

The new way to explain cricket
Cricket has a lot of information; we, and others, decided it was time to finally use it.

Buy your copy of 'The Art of Batting' here:
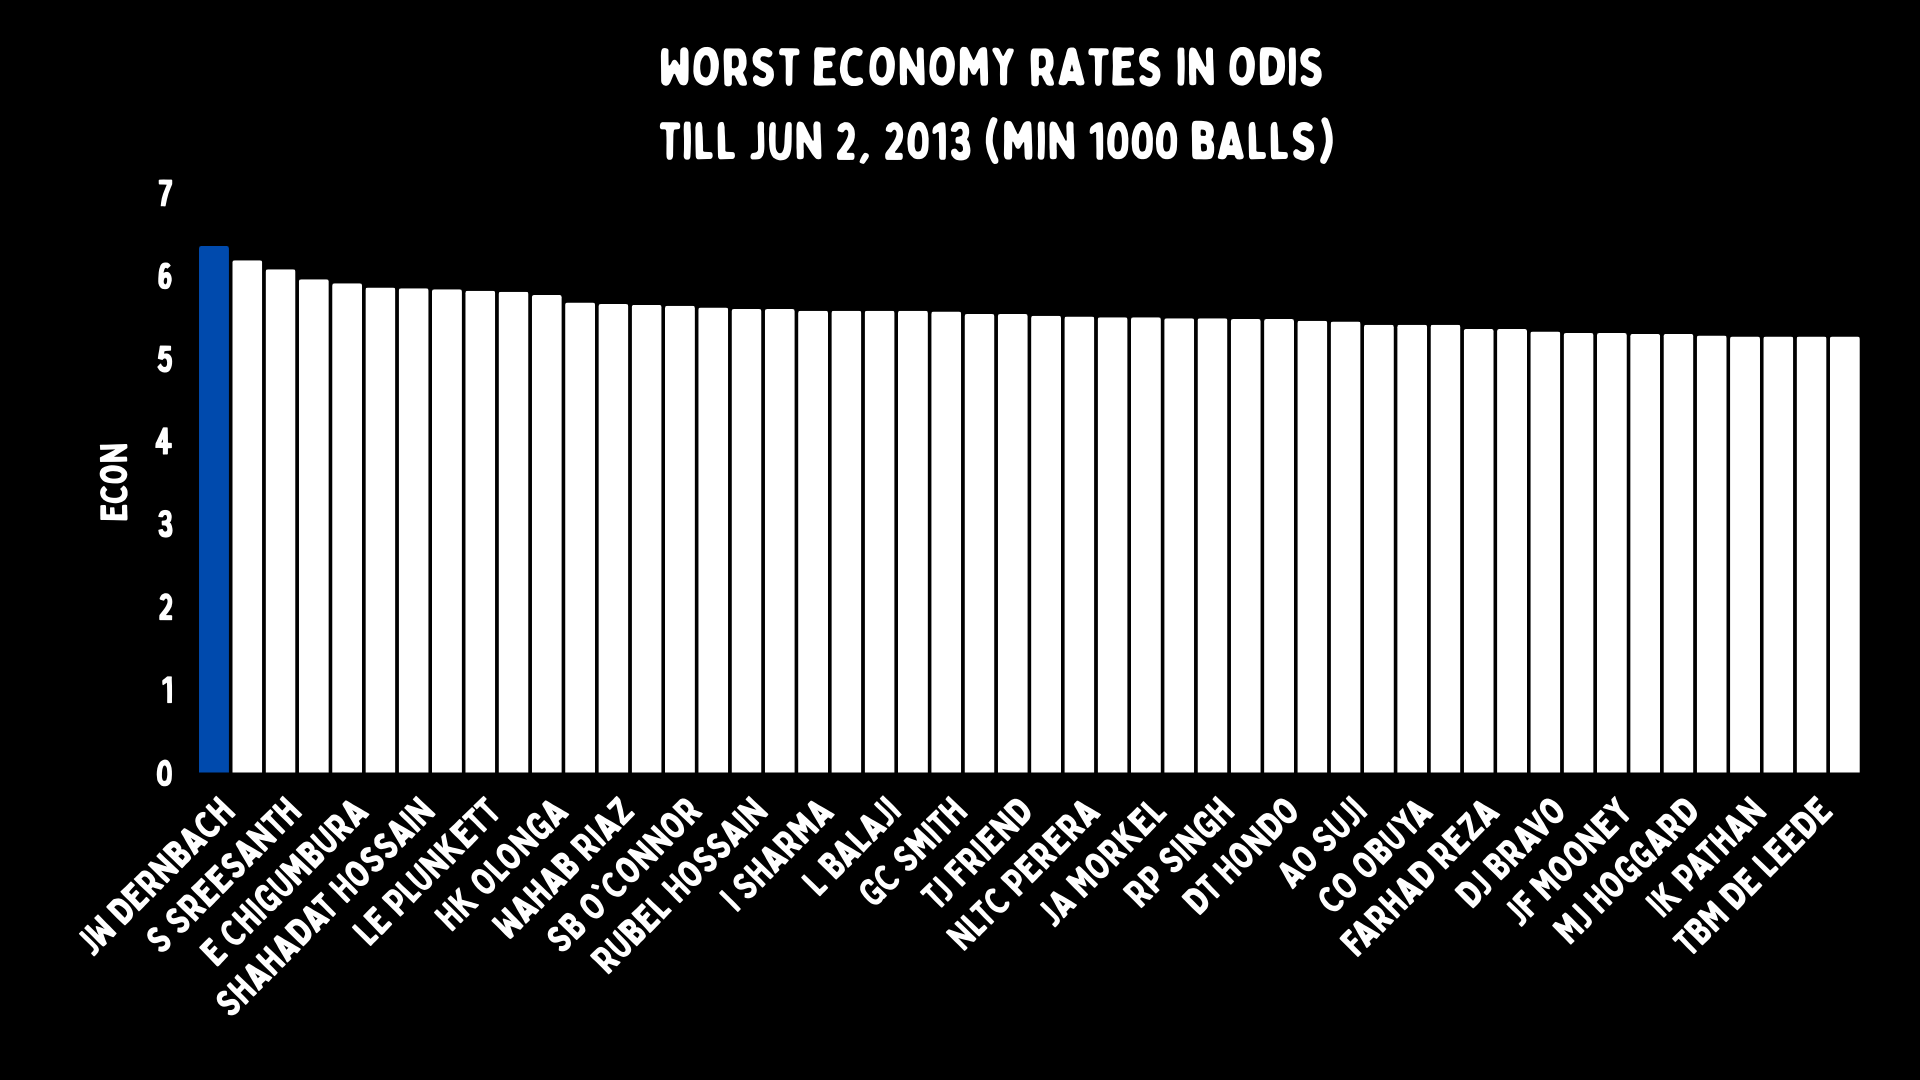
Jade Dernbach changed my career. Before him, I was a feature writer, purely looking for narrative arcs, with stats almost as punctuation. But there was something about Dernbach as a bowler that really annoyed me. And it had nothing to do with him. It was the commentators. Dernbach would come on, and straight away someone would say he was the most expensive bowler in ODI history.
He was. 440 bowlers had delivered 1000 ODI balls, but no one had ever gone for more than his 6.35. Dernbach doesn’t want this on his tombstone. But it also doesn’t tell us the full story of him as a bowler.
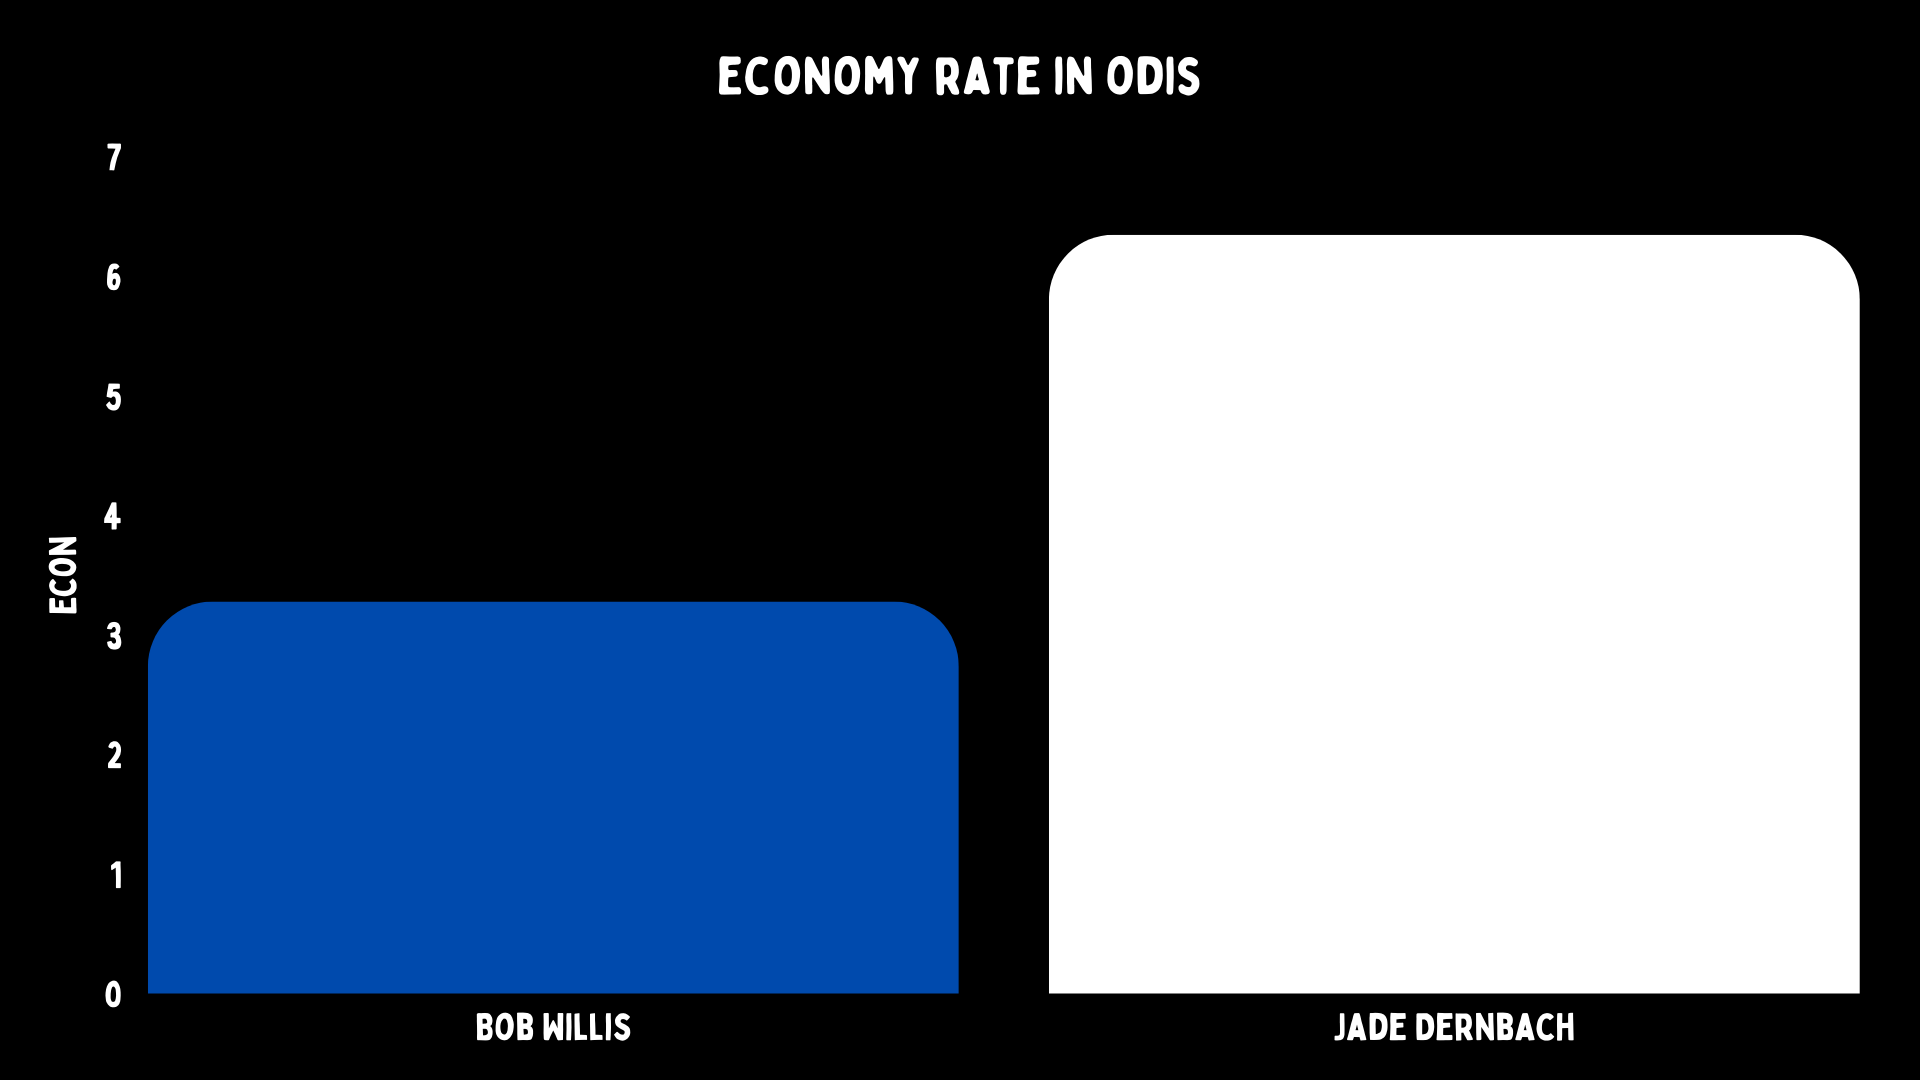
Firstly, any modern bowler was likely to be the most expensive ever, because ODIs were faster scoring by then. We can all say that Dernbach was not as good as Bob Willis, but no person with a functioning brain believes Willis was genuinely three runs an over better than Jade.
Then there was when Dernbach bowled, not the era, but in each match. There had never been a guy chosen almost entirely as a late-overs specialist. It was a new position. So you had an era when people hit more, and a new kind of bowler who was picked for the toughest part of the innings. It makes sense he had a high runs per over.
There was no context to his economy. No nuance. It was just a number spat out because, since the birth of ODIs, we had used it.
It was listening to a Big Bash broadcast bring this up that led me to invent something for Dernbach - and for all bowlers - to get a better idea of their numbers. True Economy.
I took the idea from basketball, so I kept the same name.
In that sport, you score from free throws (1-pointers), inside the arc (2-pointers) and outside the arc (3-pointers). But these were never combined, so the players with the best field goal percentage (shots made) would usually be 7-foot giants who only made two-pointers from near the rim. Yet the most efficient scorers are usually those who draw fouls or shoot a high percentage of three-pointers. So a new metric was brought in: true shooting percentage.
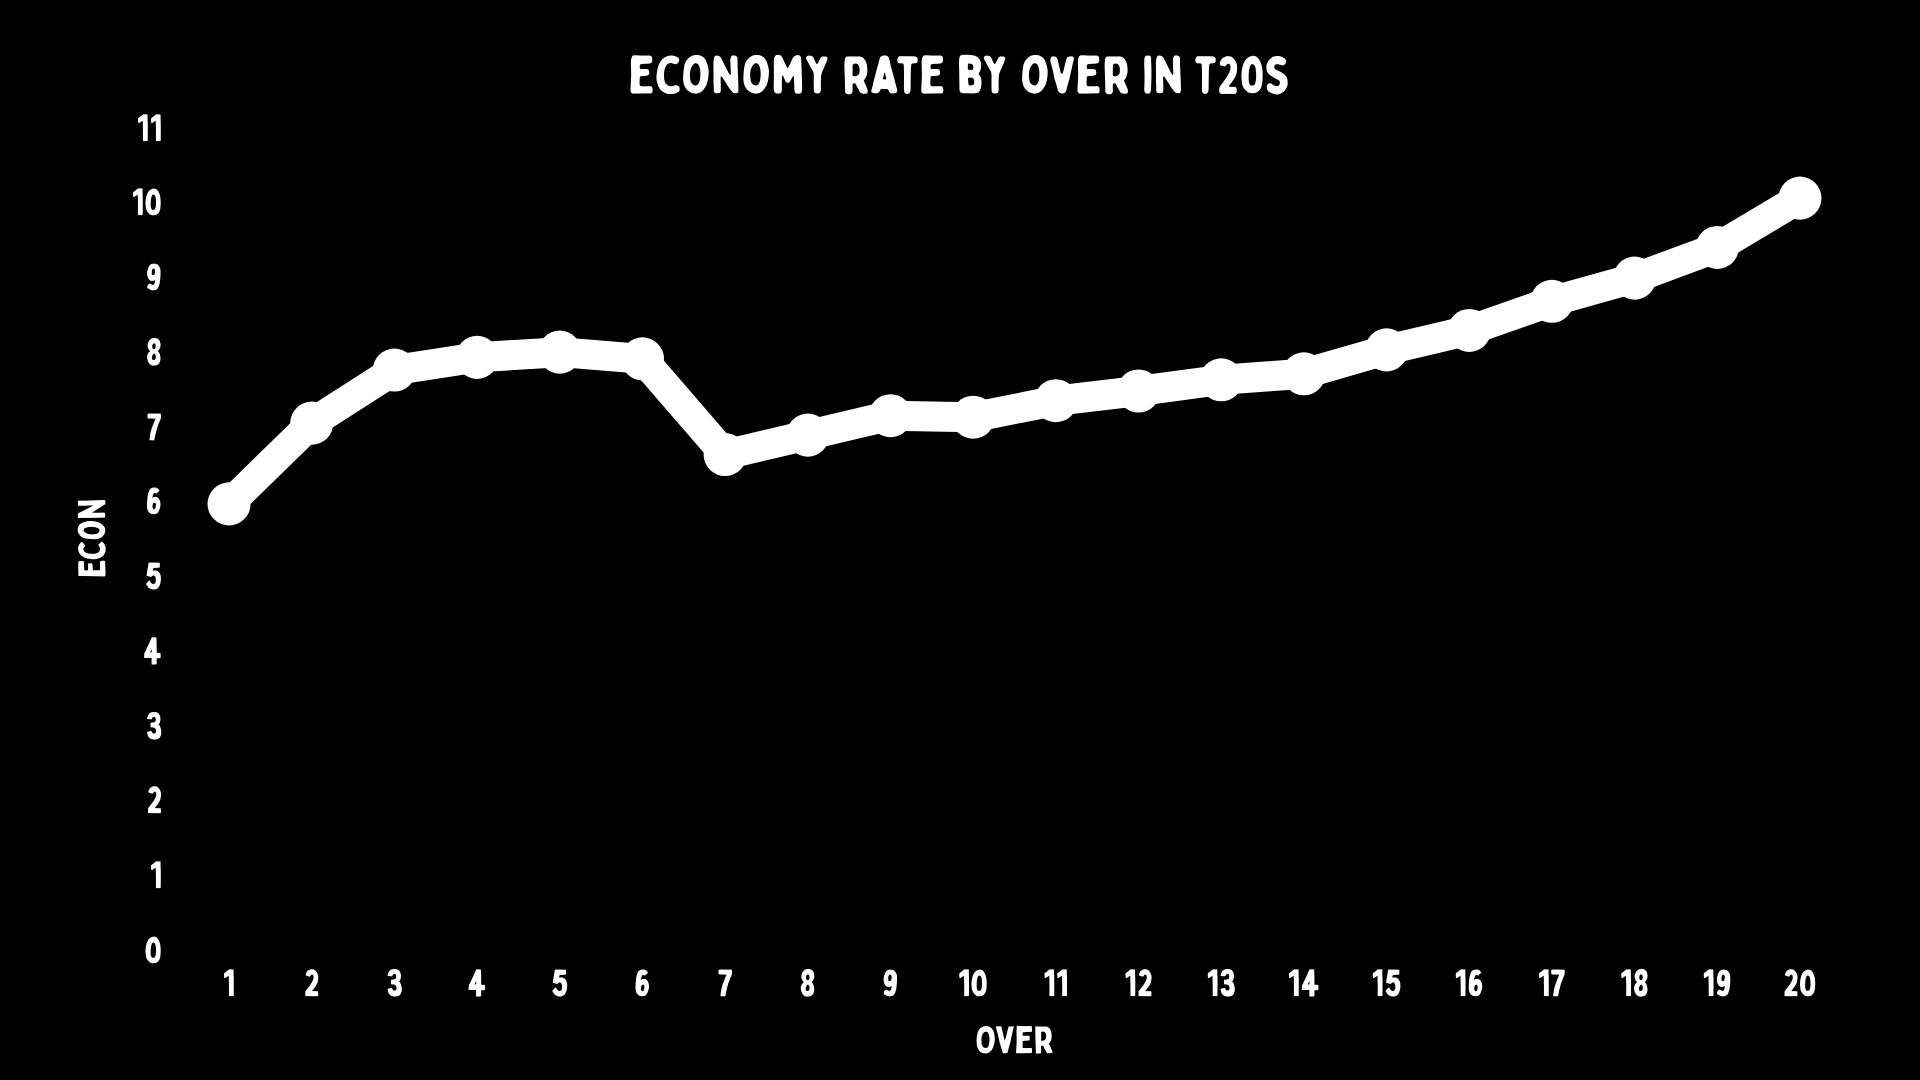
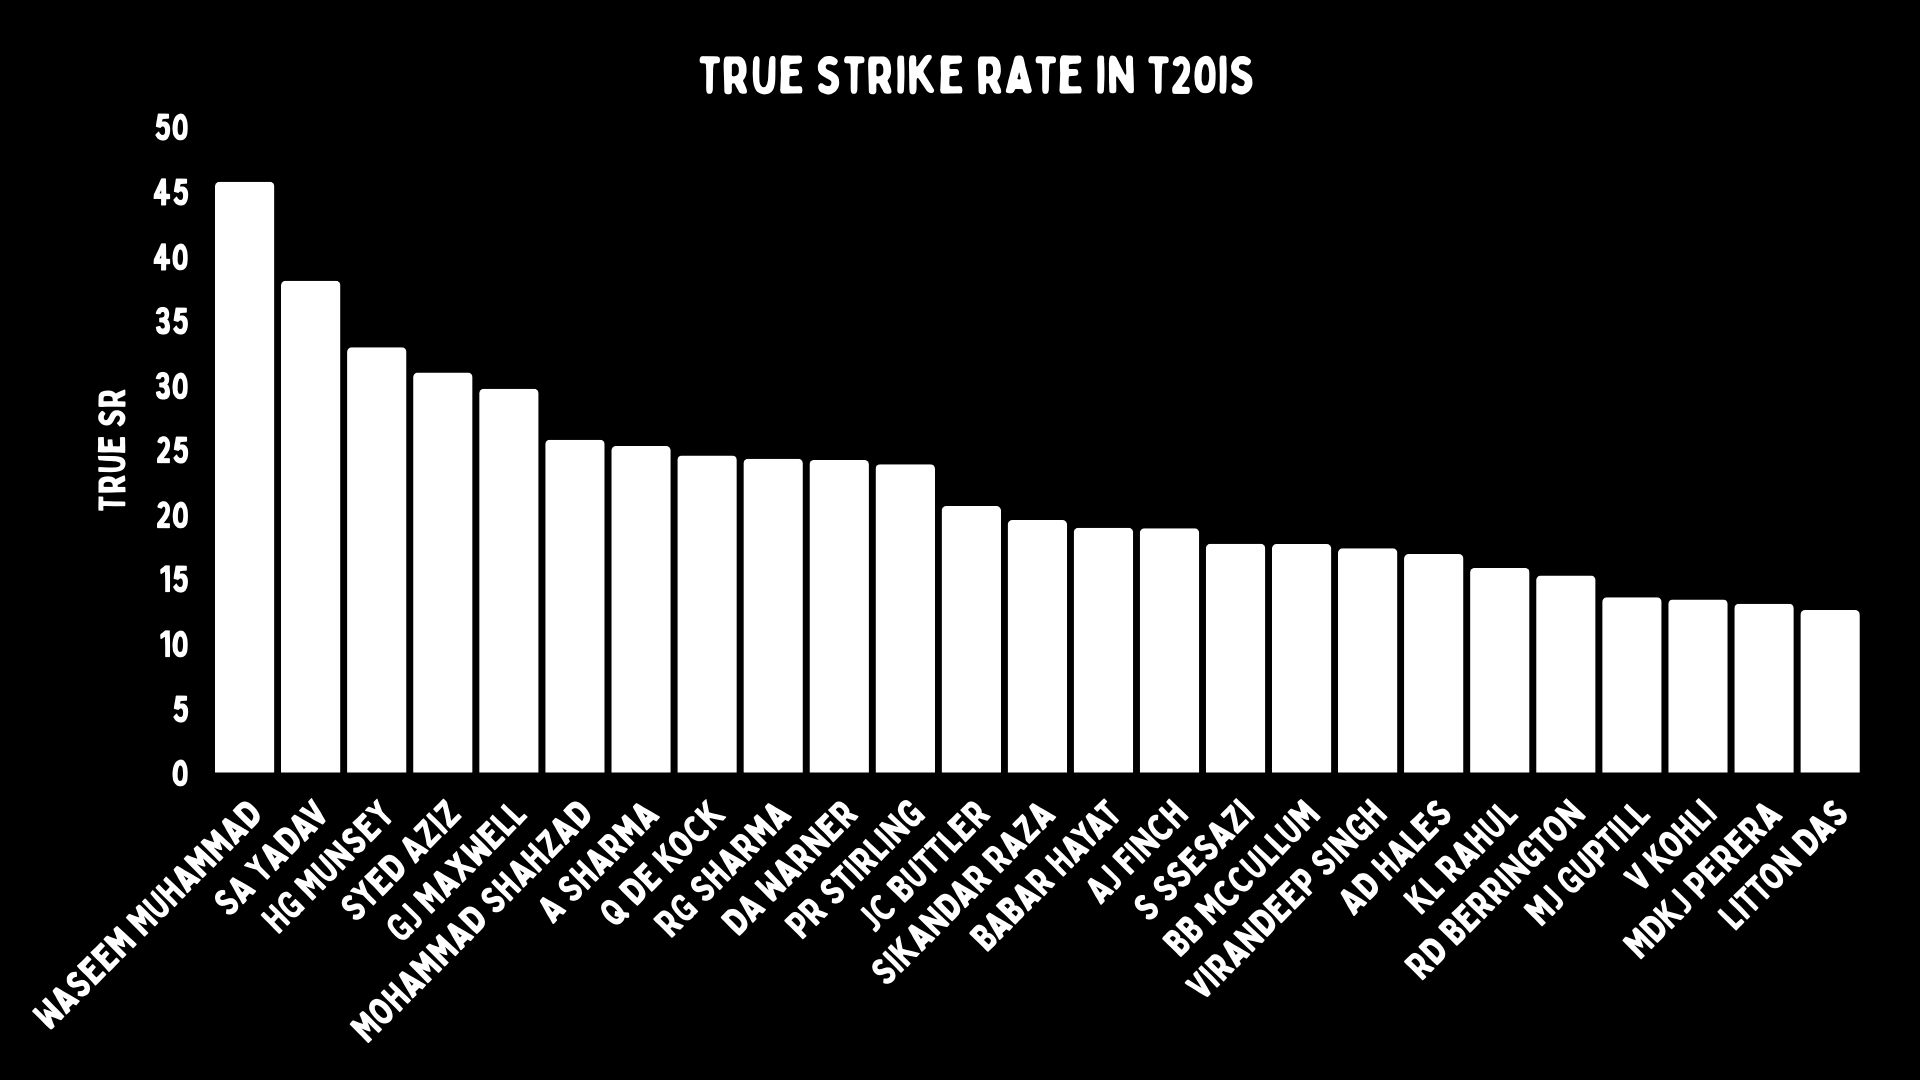
For cricket, I adapted this and brought in true economy. It works like this: we know the expected runs for each ball in T20. The first ball of a T20 match usually goes for 0.78 runs. So if you allow a single, you are -0.22 on true strike rate, and if it’s a dot, you are 0.78 ahead. We can work this out for every single ball of one-day and T20 cricket. Why would we use an old-fashioned metric that only flattered spinners bowling in the soft middle overs?
And once true economy was used, we added true strike rate as well - which is the exact same thing for batters.
So instead of having a strike rate of 138, you might have a true strike rate of minus three. The first number is handy, the second gives so much more.
But why stop there? Cricket has a lot of information; we, and others, decided it was time to finally use it.
Welcome to the new world of metrics that help explain cricket.
We really wanted to illustrate what all these new measures were. We think they’re important when discussing the sport, but we also know that stopping to explain every metric in every piece is essentially impossible. So consider this the one-stop shop of all the different metrics and new versions of analysis we use now.
True wickets
True economy and strike rate led us to look at true wickets. Again, using the same idea of knowing what happens on certain balls, we can tell how many wickets are due for when people bowl - because obviously in the middle overs there are a lot fewer wickets than at the death.
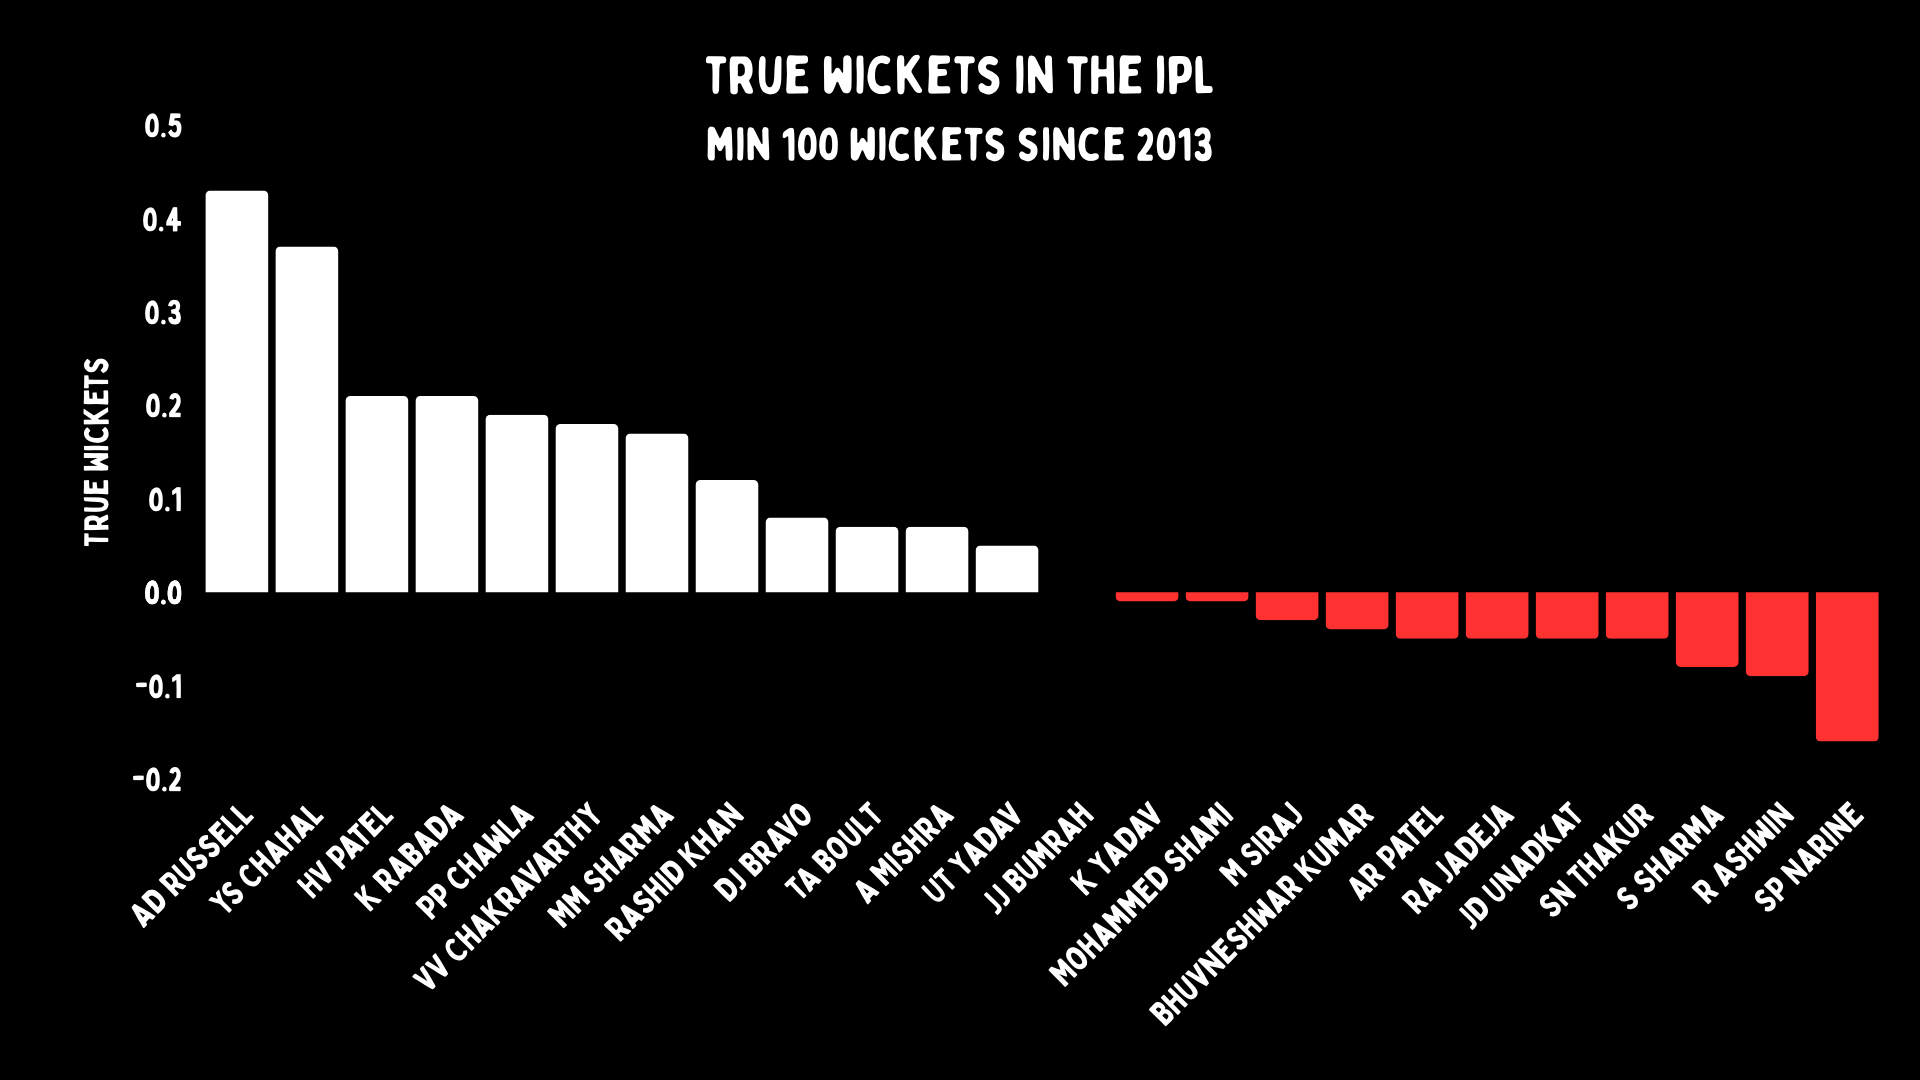
A bowler with 30 wickets in a tournament is great, but if 20 of them come at the death, and someone always takes 20 at the top, the new ball bowlers are much more important. And generally wicket tallies are dominated by death bowlers, whereas true wickets helps powerplay quicks and spinners in the middle. That gives us a better idea of who the best wicket taker is.
True average
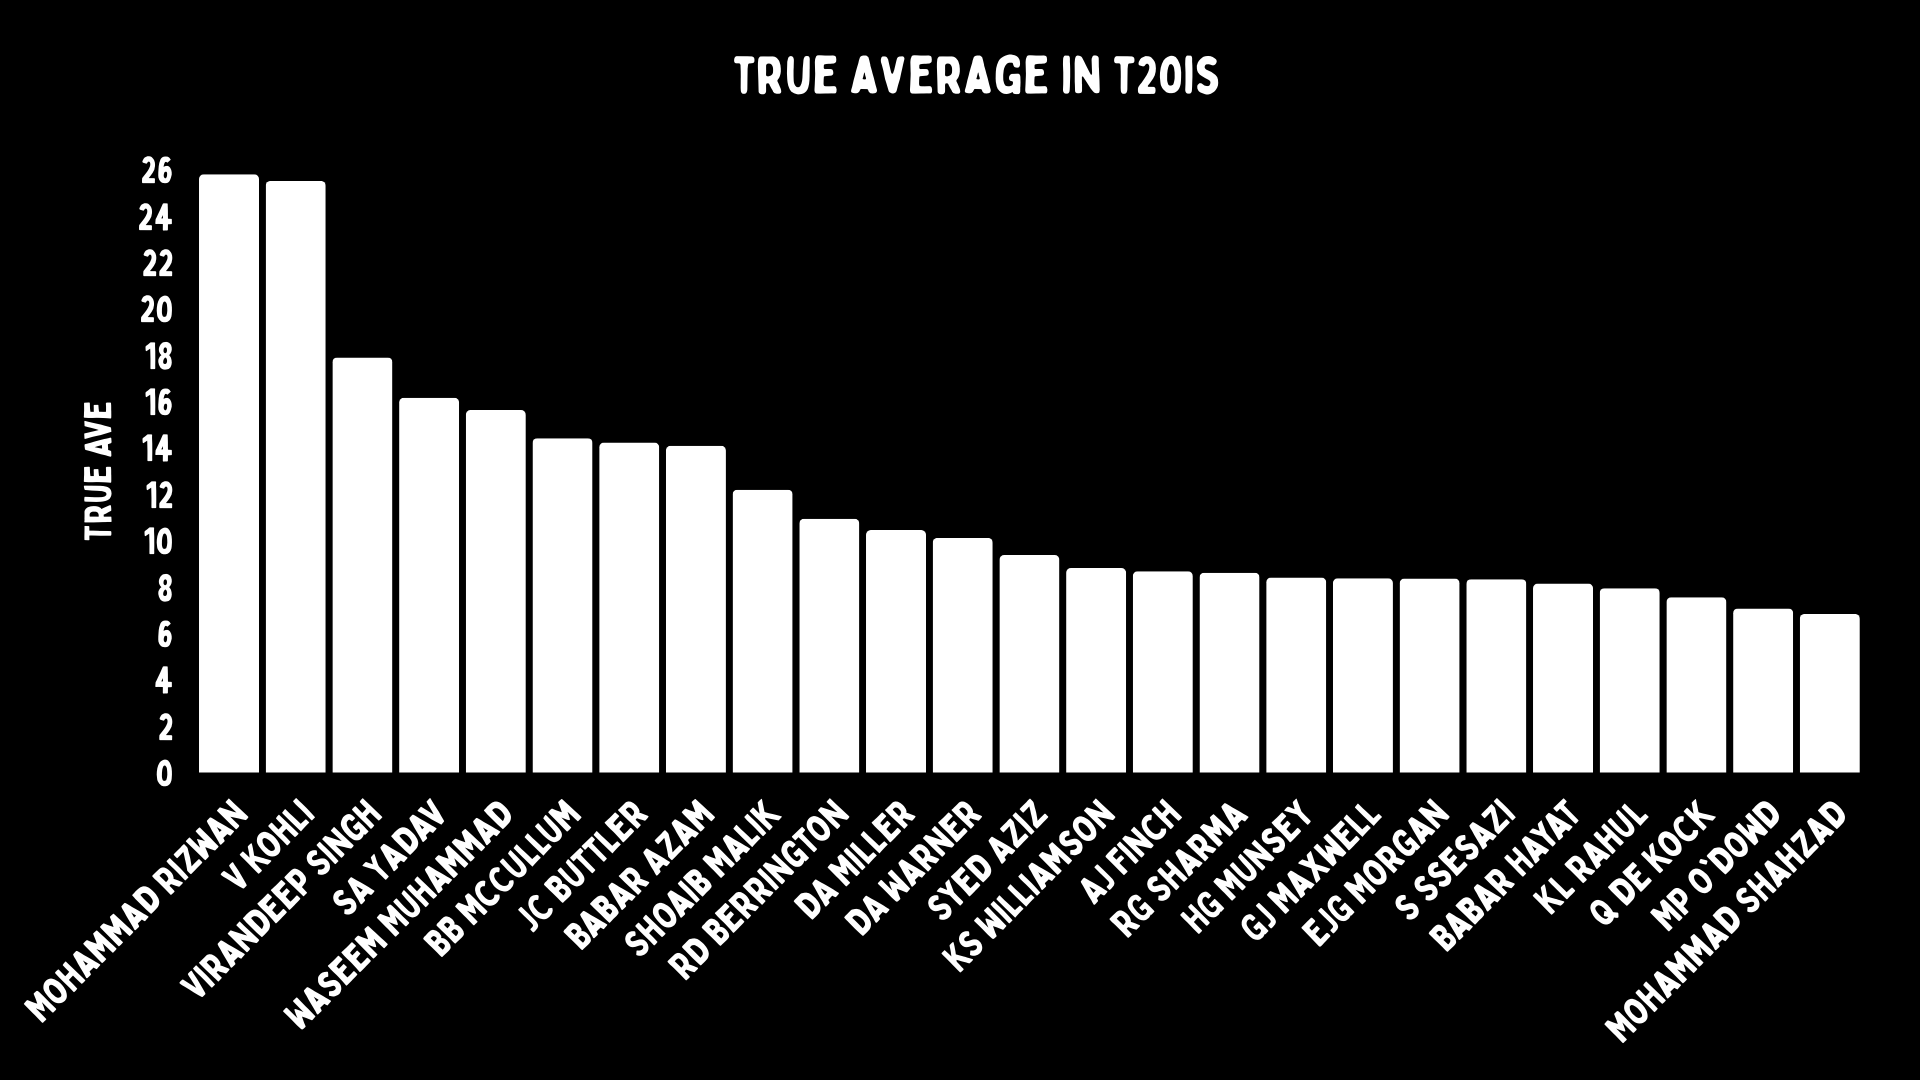
True average is a function of how the normal batter has gone in the same over distribution. If you are a middle-order batter you are expected to have a high average since you bat in the low-risk overs. But if you’re a finisher, you will go from ball one and be dismissed more often. So it’s difference that we account for with a true average.
True runs
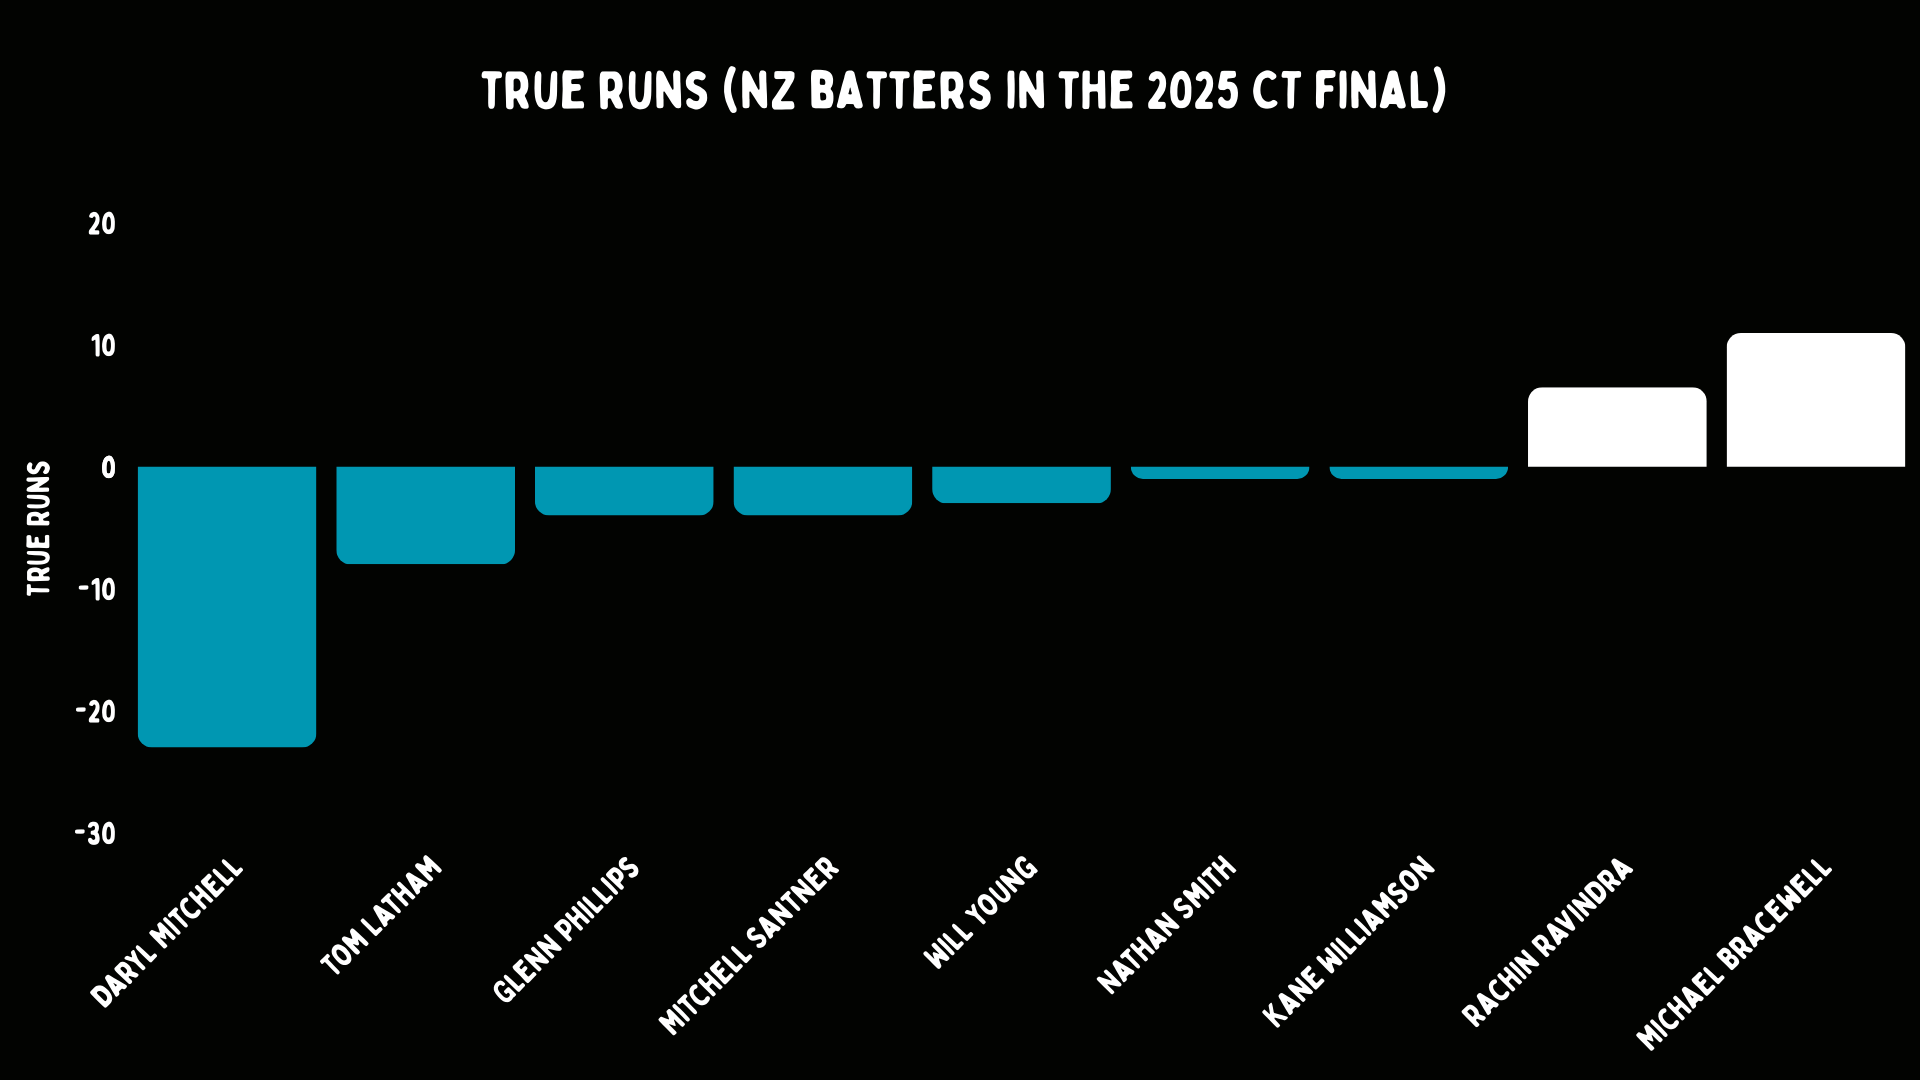
The concept of true runs is quite simple. We’ve trained a model that takes ODI data from 2016 to take into account the runs on the board, the wickets lost, the over and the balls faced by a batter to predict what they’ll score on that ball. We then calculate the difference between the runs scored and runs predicted to get the true runs. Positive is better.
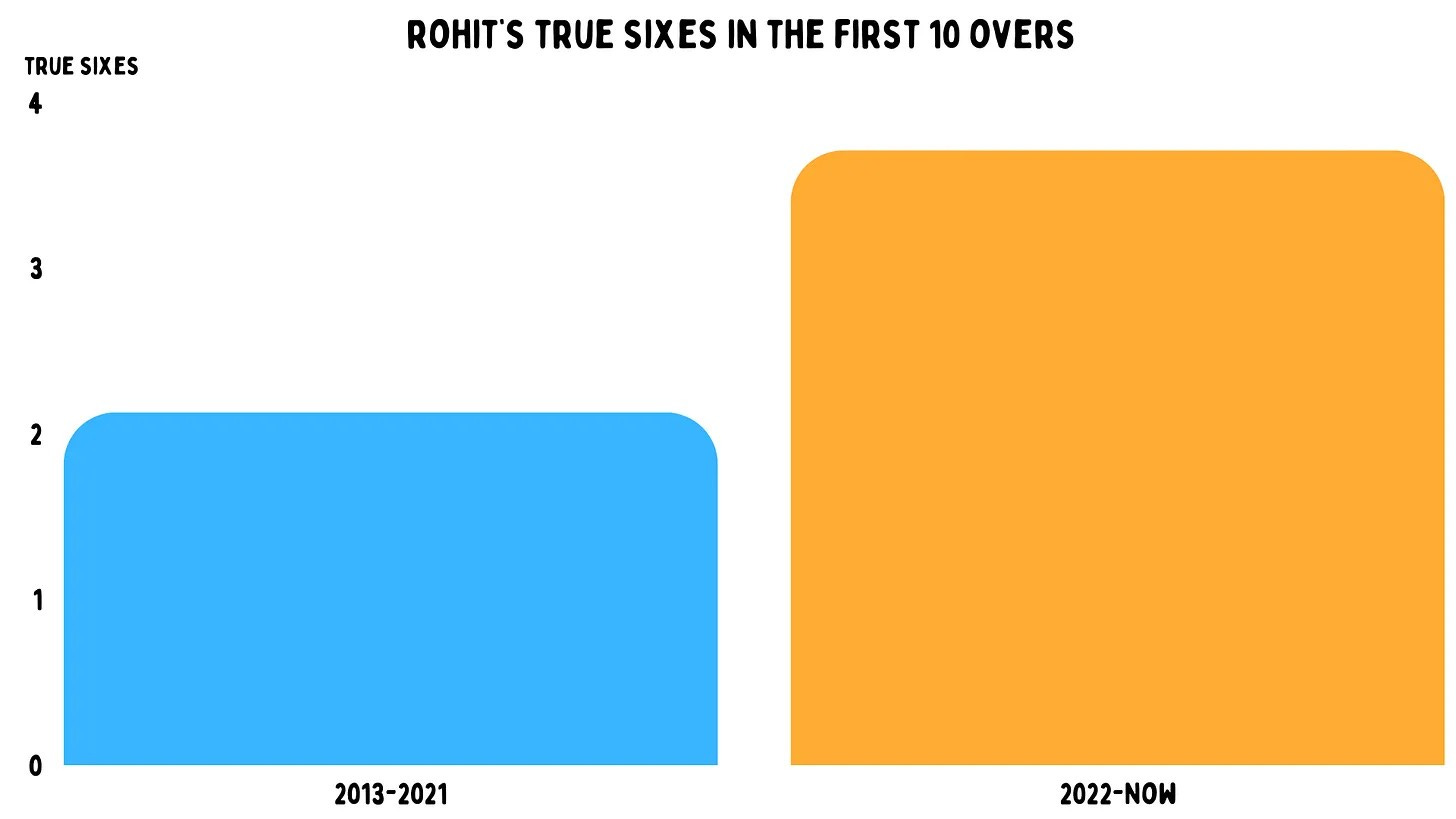
True dots to sixes
Once we know the value of every ball, there are many things we can do. One we like is to work out what kind of batter someone is. Traditional metrics of boundary (or six) percentage and dot-ball percentage are limited. Opening batters don’t hit many sixes, they hit fours. Most players strike big late in the game, but in the middle overs their main job is to keep the dots away. So if we just look at dot ball or boundary percentage, it tells you more about what number in the order the batter comes in than anything else.
Whereas, true dots to sixes again adds context. So instead of openers looking like they all chew up dot balls, we can tell which of them is actually great at manipulating the field. And those who do hit sixes, suddenly have similar numbers to guys slapping at the death.
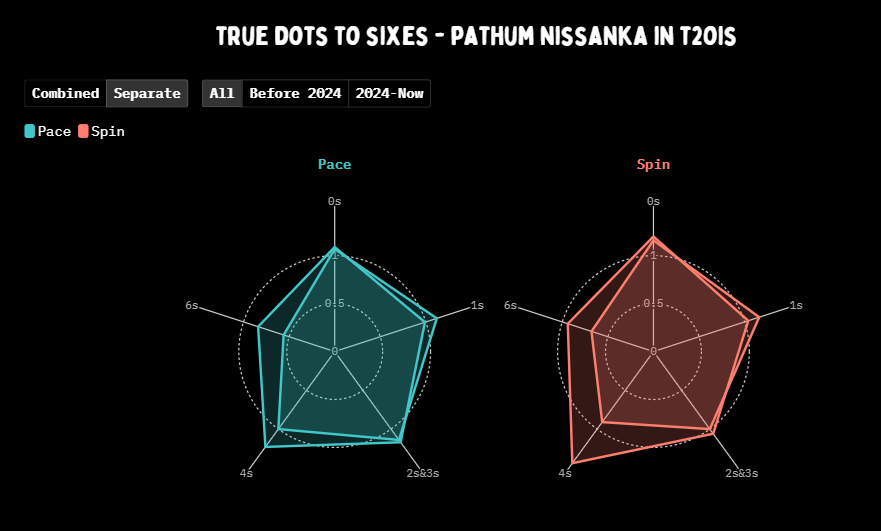
Rohit Sharma pops on this metric in ODIs, as he should.
This is a new stat that we think we invented. But dot-ball% is older; John Wright used it back in the 90s, for instance.
True first five ball strike rate
Back when I came up with true economy, there was something else I was really interested in: how fast batters started. It was really obvious to me that there were guys who knocked it around, and others who went bang. But again, the first-five-ball strike rate - while handy - was still stuck with the fact that middle-order players started slow, and everyone else was quick. Now we can work out which players start fast or slow, and this is really handy for teams – you don’t want a side where too many players begin sluggish.
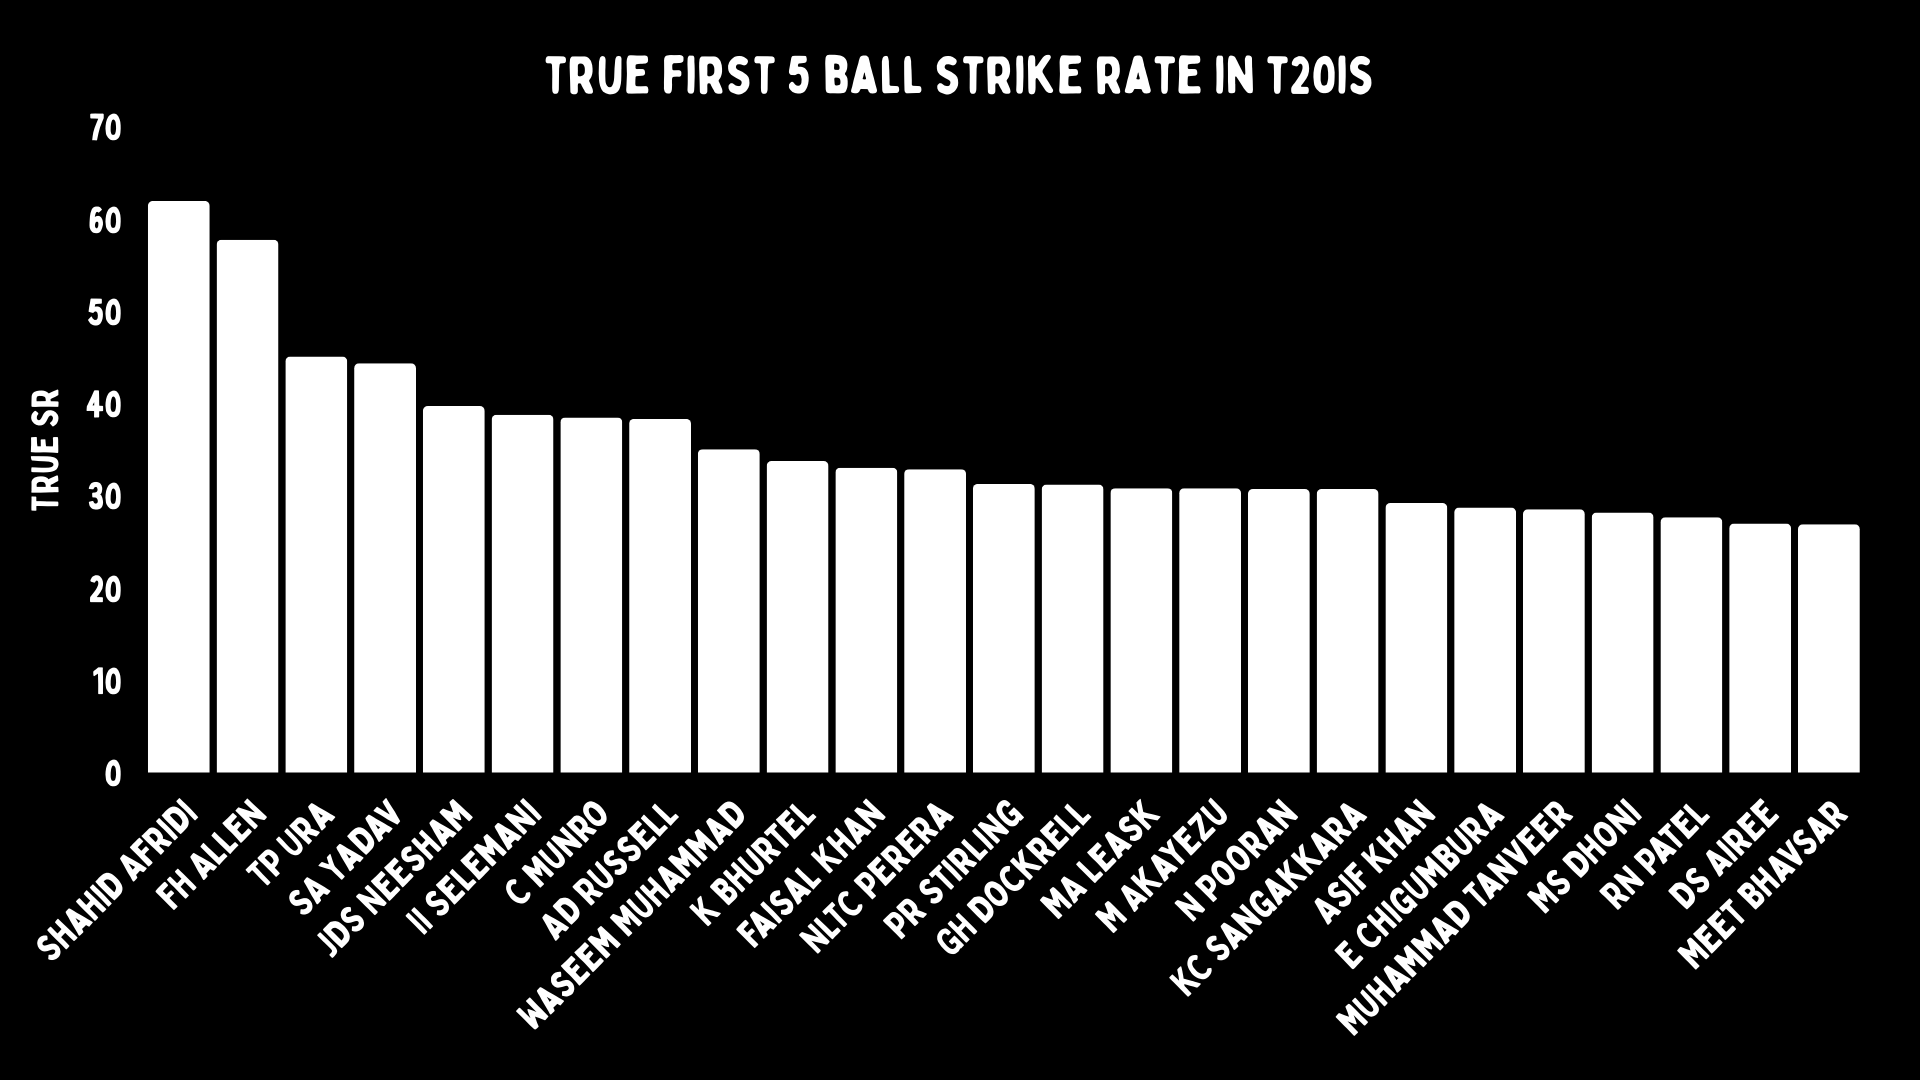
Shoutout to the king of this, Luke Ronchi, whose nervous energy meant he started every knock like his arse was on fire.
Impact
Himanish Ganjoo has an impact metric we use. Essentially, we take the par score for a T20 match, and then look at what the expected total is after a batter has done their thing. The same for the bowling. So if par was 170, and when the batter is out it’s 175, they are plus five.
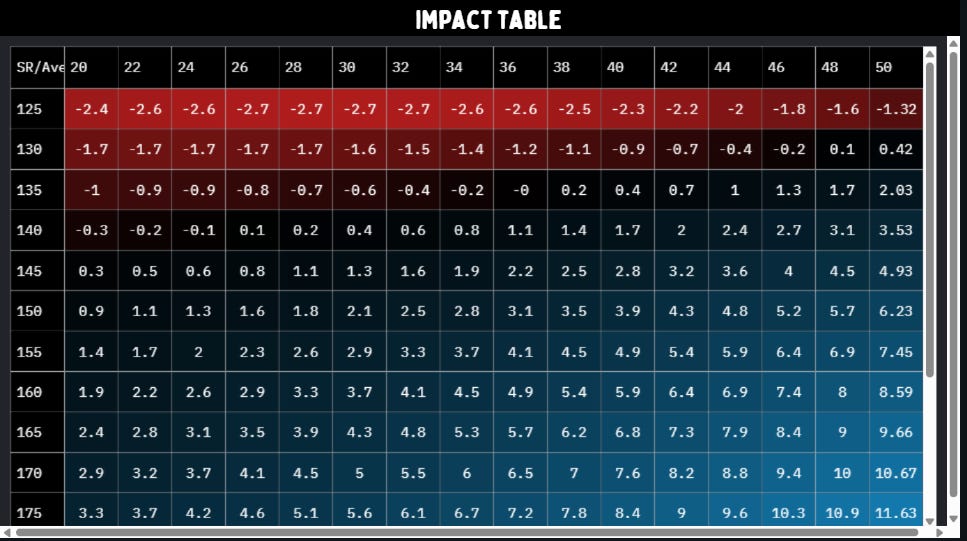
The same thing works for bowling, but of course the opposite way.
All of these stats work well for ODIs and T20s. But they also work great for the 20-over game when looking at players from different eras. That isn’t the case for ODIs, as most ball-by-ball data only starts existing from 1999 onwards.
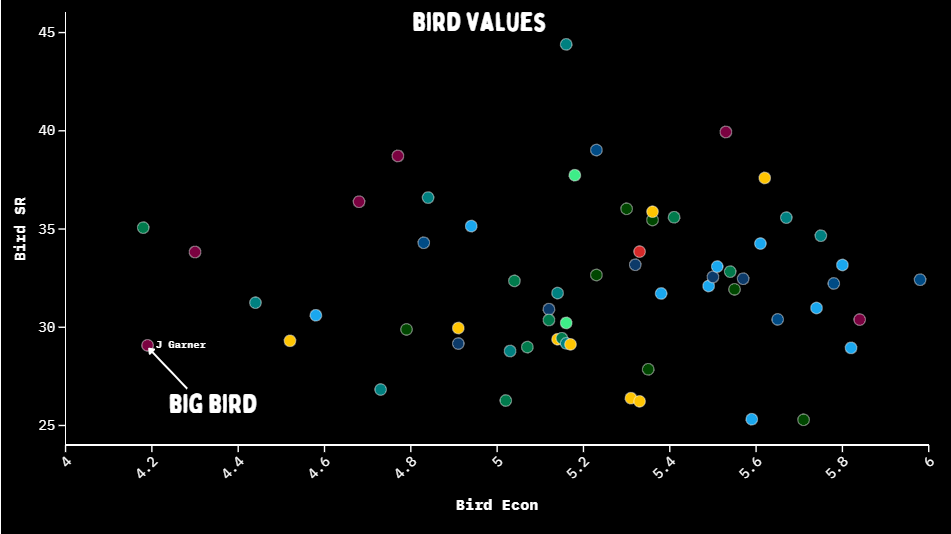
Bird Numbers
So how do you compare players across eras for the 50-over game? For that, Varun Alvakonda came up with a method that normalises your average and strike rate for the modern era. It’s not as good a system as true economy and true wickets because it lacks granular data. But it points out that Joel Garner wouldn’t have gone at 3.1 an over in modern cricket.
And they are called Bird Numbers because that was his nickname. By giving every player modern numbers, it’s far easier to compare across era. And Big Bird is still great.
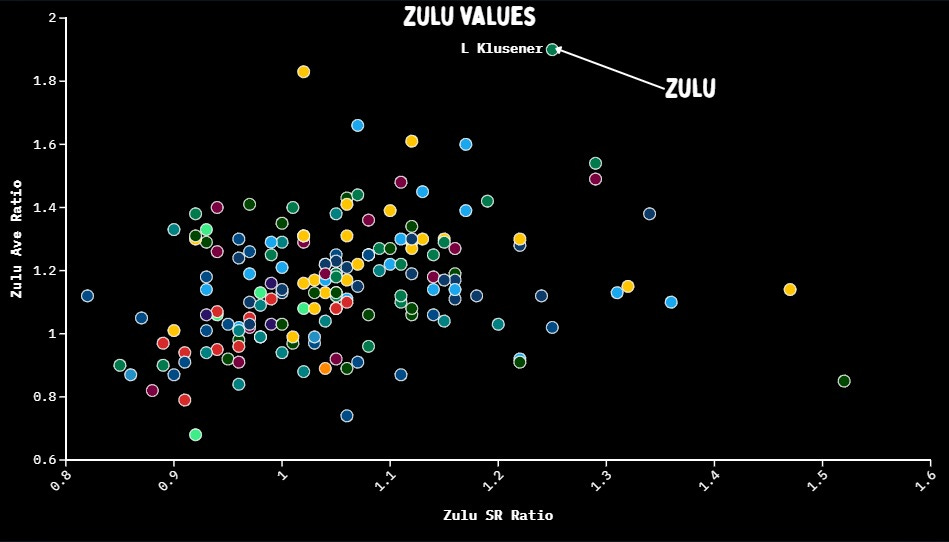
Zulu Numbers
Zulu Numbers cover the batters, and that was Lance Klusener’s nickname. Again, we want to show that a strike rate of 90 in 2004 is worth a whole lot more now. These are more useful when looking at the best players ever - they are almost entirely for fan use, but they still help understand players more.
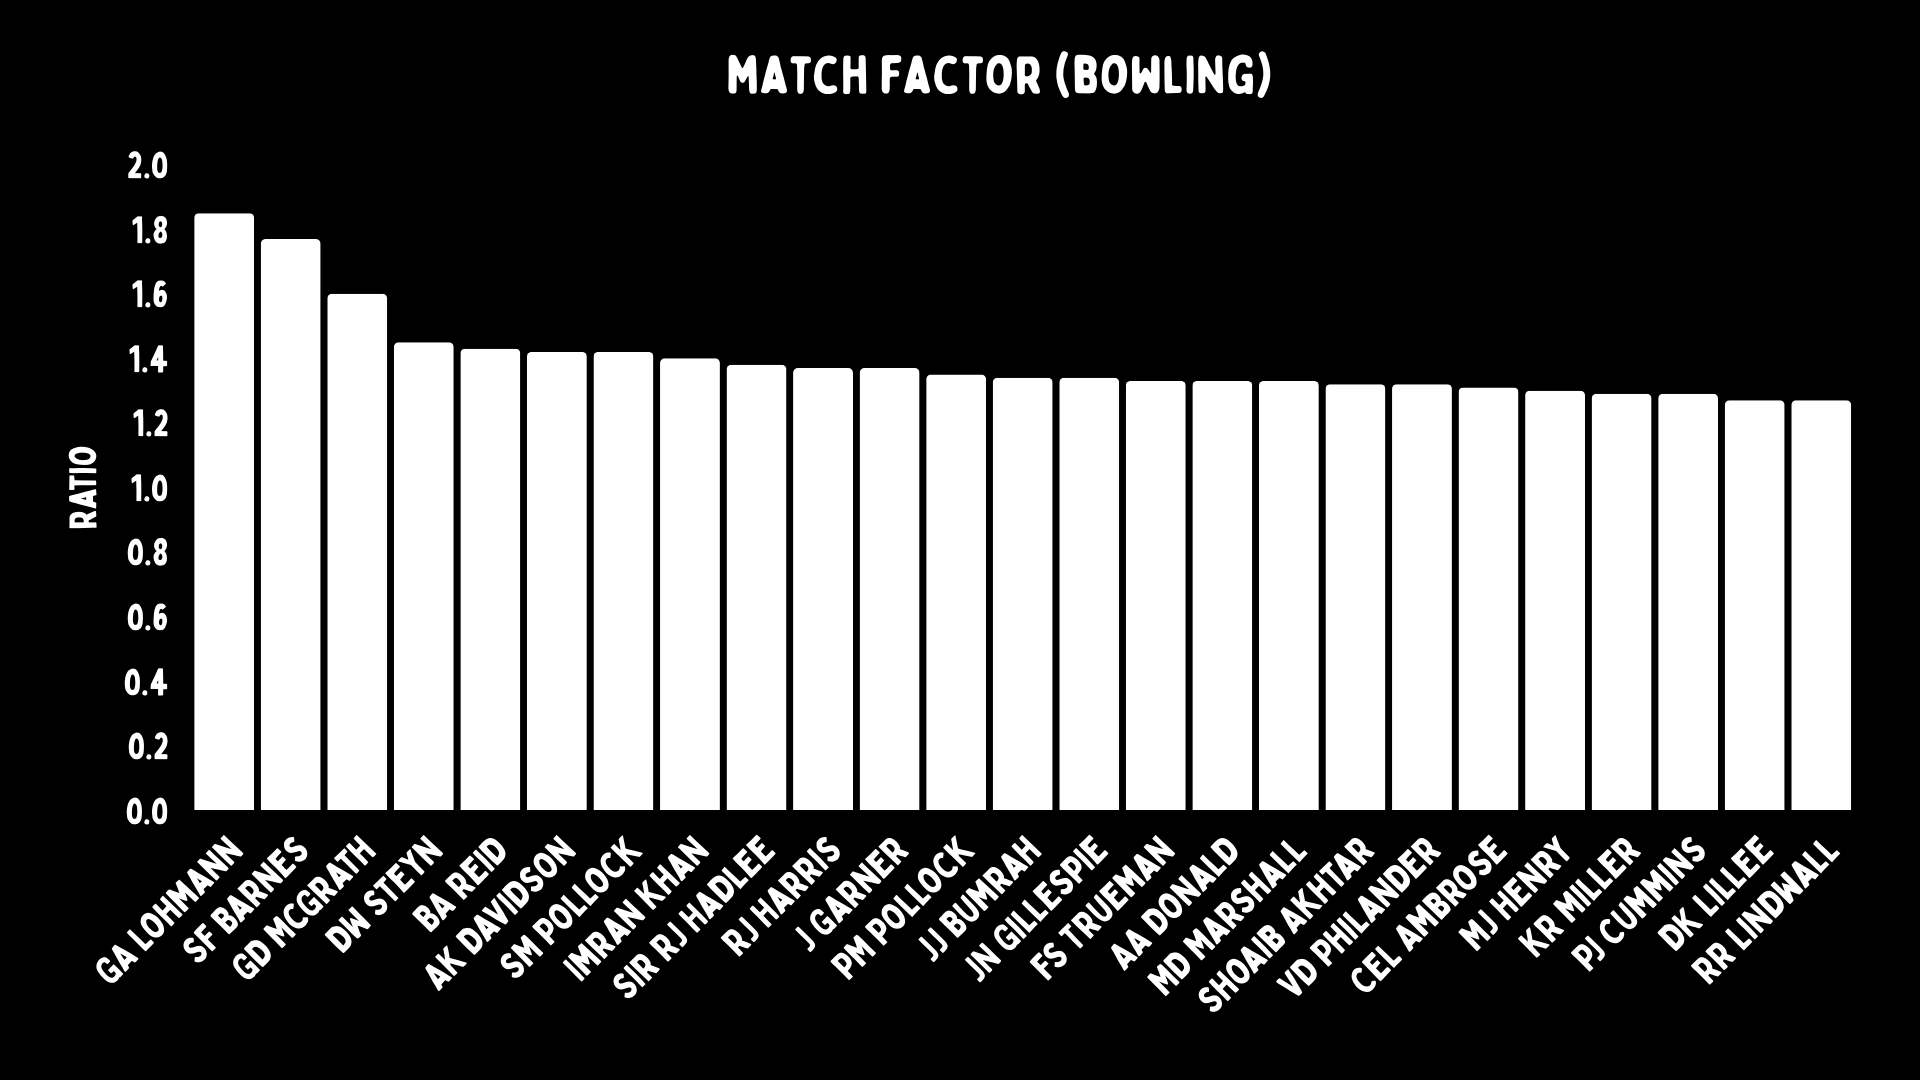
Match Factor
There are some numbers that can work for all three formats, like match factor. But we use it the most in Tests. It allows us to check a batter against the top order in the same matches. It can be warped if you happen to be in a team with a great bowling or batting team. However, it does tell you the kinds of pitches most players have been on. Some great players really get hosed because of their wickets.
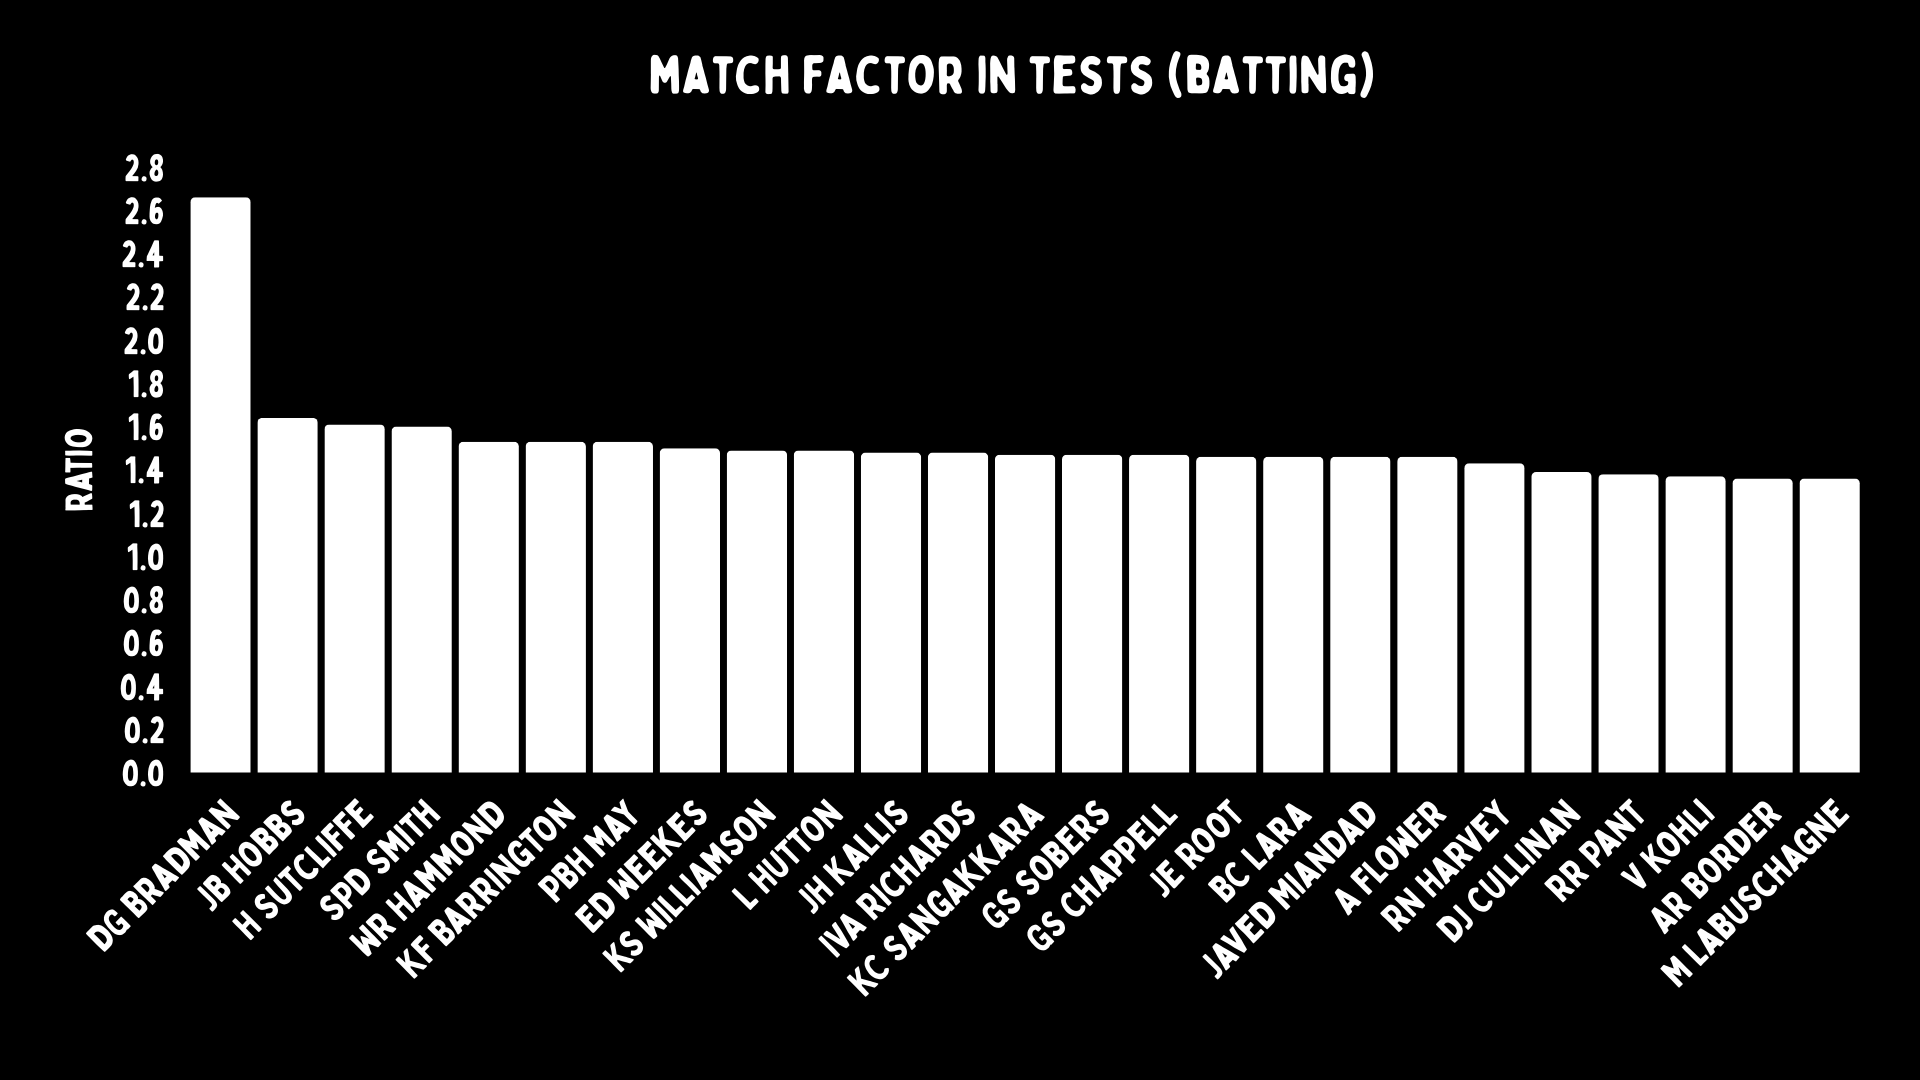
We look at bowlers for this too, comparing spin to spin and pace to pace.
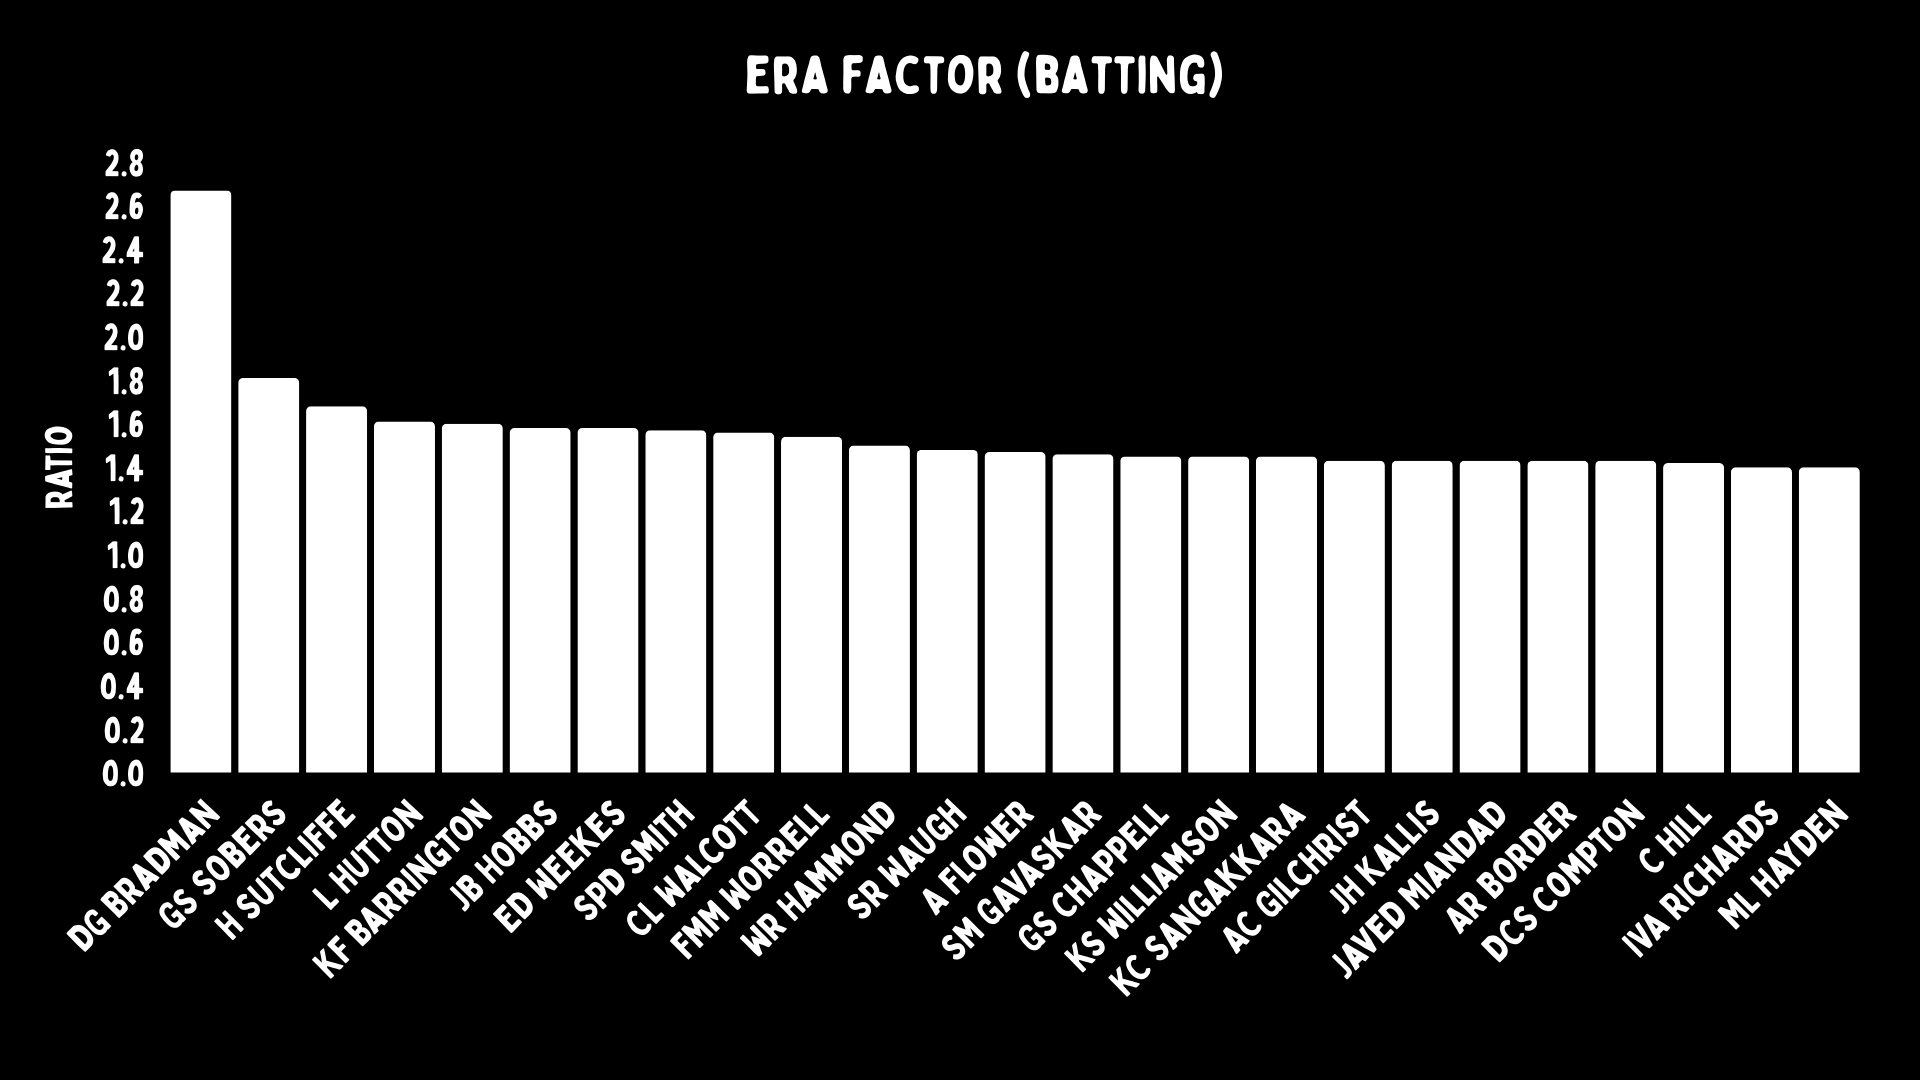
Era Factor
Era factor is similar, but it has some differences. One thing we do with it is check players at the same position, in the same era that the player was in. Using both match and era together is the best option. Era factor is really useful, but right now Sri Lankan wickets are easy to bat on, and almost nowhere else is. So again this gives you some info, more than before, but it’s not a single number you should believe in.
Lateral movement
Another thing we have worked on for the book The Art of Batting is to look at openers in Tests by their records in England, New Zealand and South Africa. It gives you an idea of their play against the moving ball. For modern players, we have information that helps more than this, but this is really useful for old cricketers.
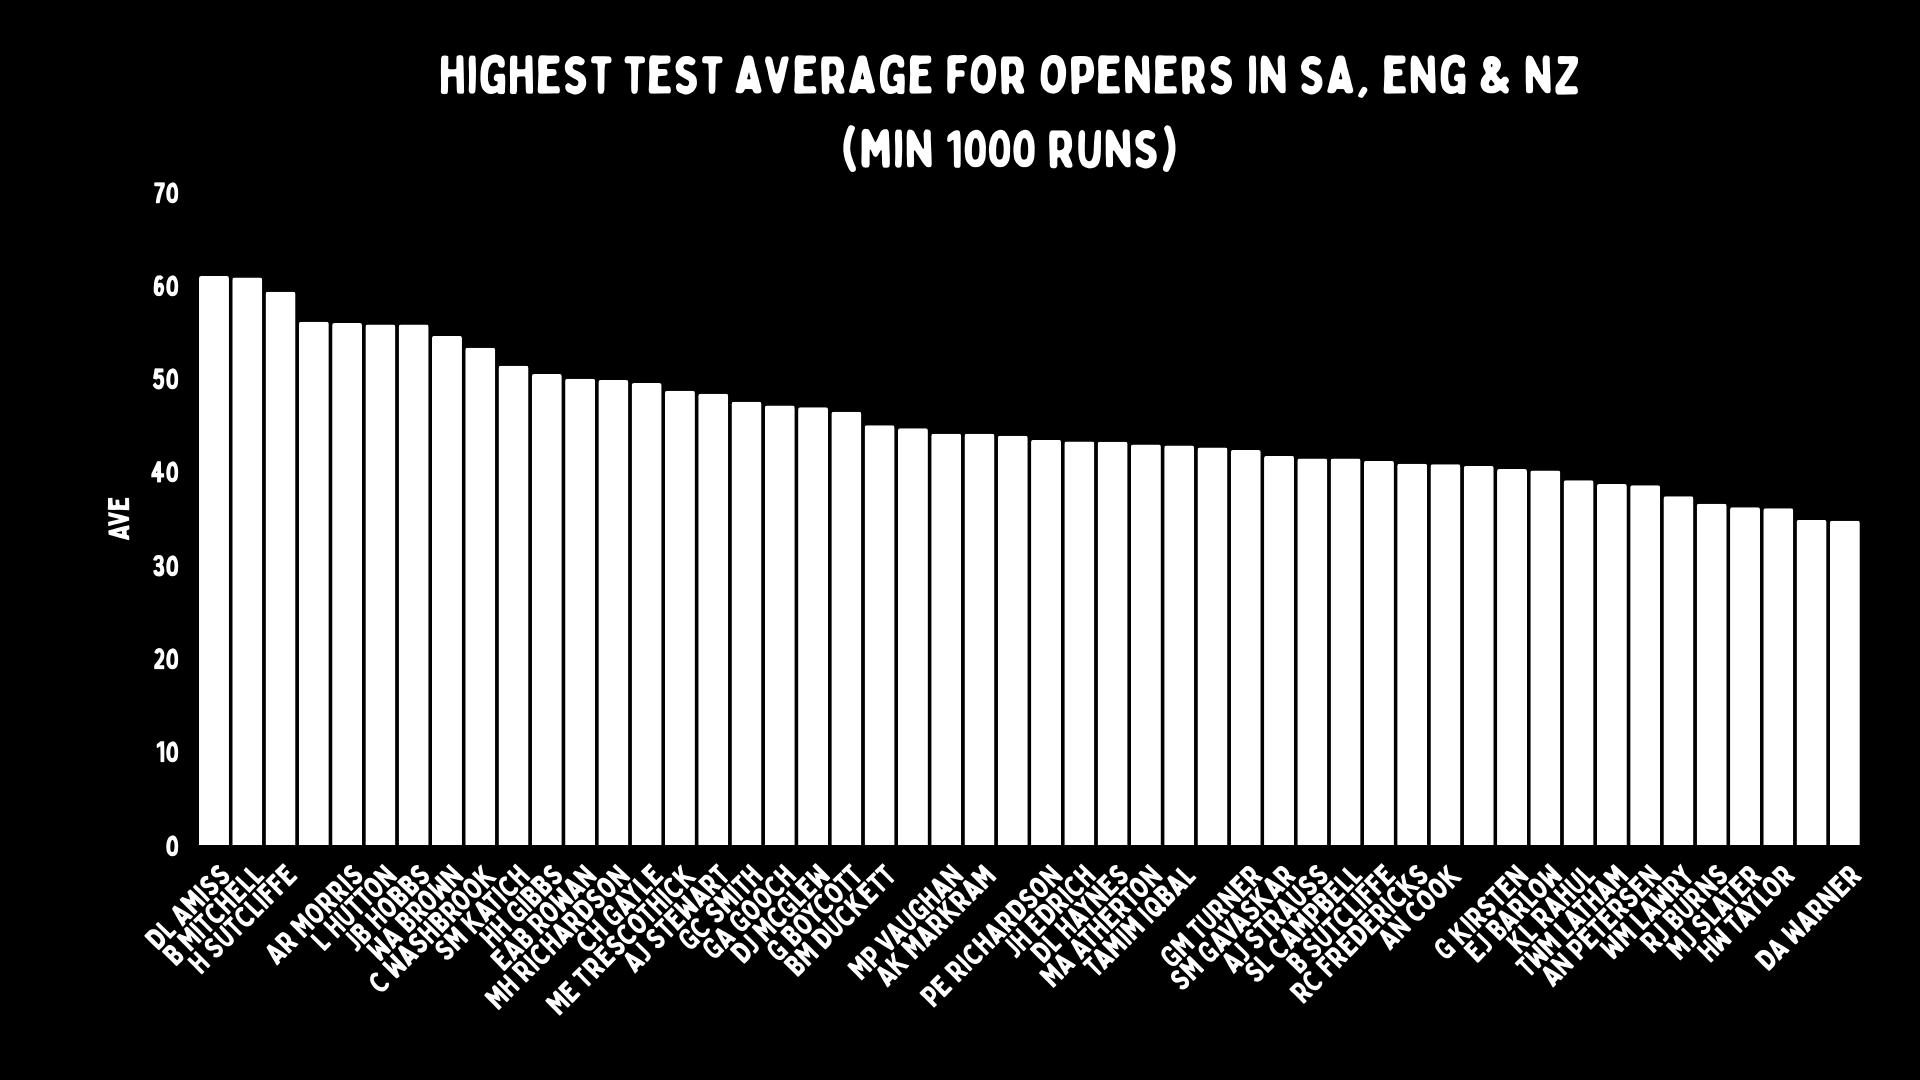
It’s no different to what old fans did when looking at records in Asia to understand how good someone was against spin. Neither of these are foolproof, but they give you more of an idea.
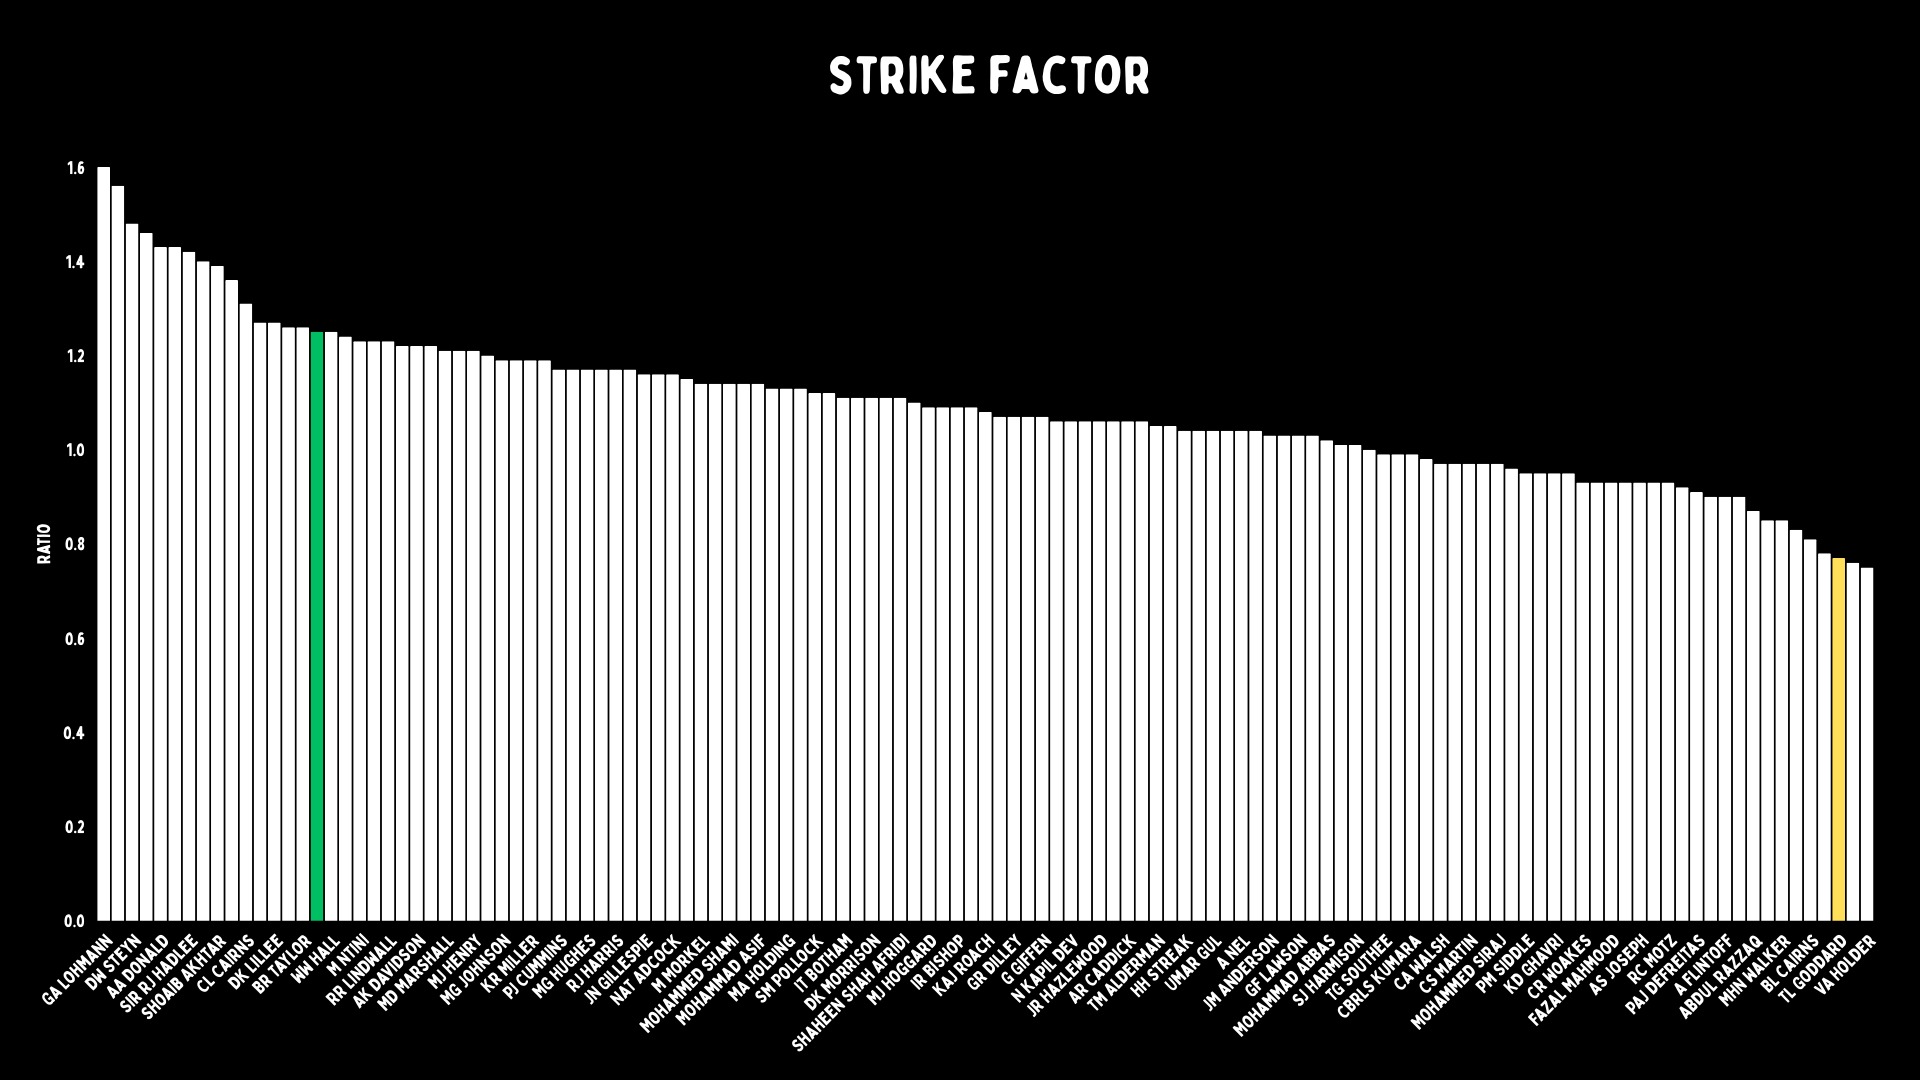
Strike factor
Strike factor in Tests is something we use because you can’t really compare Kagiso Rabada’s strike rate in this constant-wicket period to Trevor Goddard’s dead-ball era. I mean, there is no stat that is going to get them together, but it at least adjusts for era.
Expected average
All the ones we use are here, but there are plenty more analysts have created that we aren’t even aware of publicly. People come up with others but don’t have the voice to share them. CricViz have more data than anyone else, and they have expected average. Essentially, when a ball is delivered, they go through the Hawkeye system to see how many other times a ball like that has been delivered, and then calculate what the combined average is.
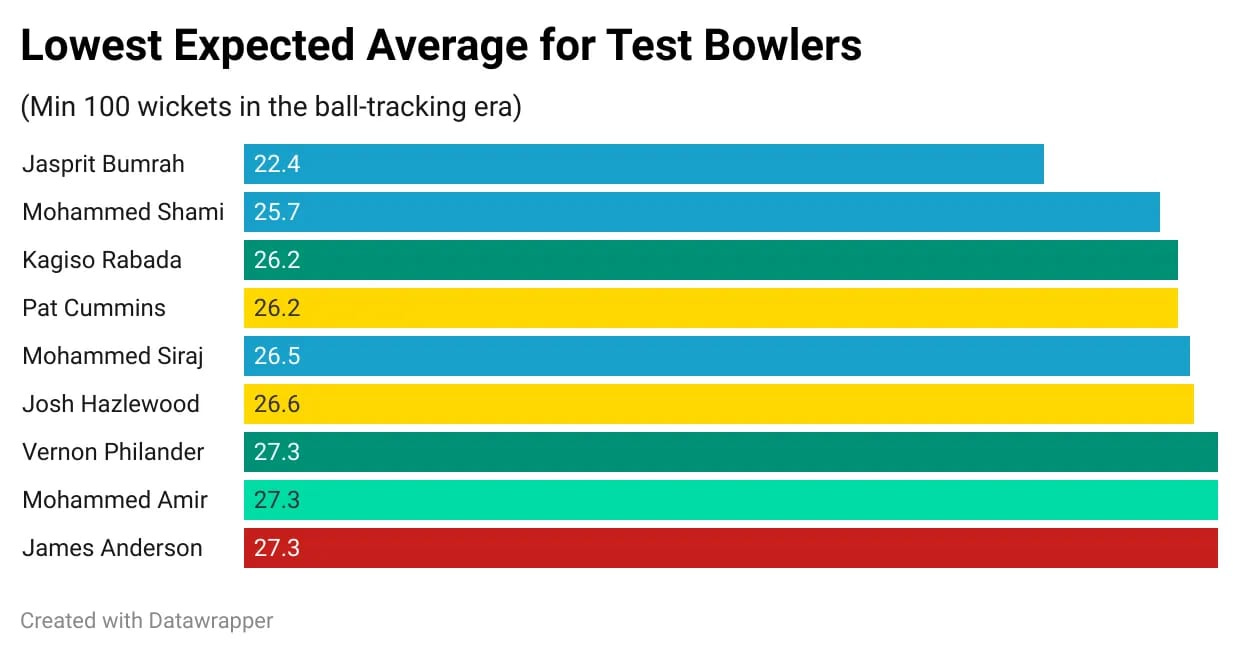
So an outswinger pitching on middle stump and hitting off at 143 kph might average five, while a 78 clicks long hop might be 87. They then calculate the expected average of bowlers from that. And also what the batters should have made.
When I had access to CricViz, I loved trying to find a ball with an expected average of less than two. But my favourite was when Tim Southee was dismissed from a low full toss down the leg side, and I think the expected average was over 200.
Other metrics
There are also things like Runs Above Average, which Mainuddin Ahmad Jonas came up with. There are plenty of different names for the same metrics, or a similar idea with slightly different execution. Without a website like Baseball Reference to collate all of this, too many people will end up coming up with the same metric, not knowing it already exists.
Others will be superseded by new metrics. In 2018, I came up with a few options for a new T20 vocabulary. True economy and strike rate are still here, while activity rate doesn’t matter as much in a world of true dots to sixes. Balls per boundary is handy, but again can be picked up in another metric.
But other things are still used occasionally in cricket. Since our book, median is something we have used more. It was in cricket from time to time, but should be talked about more.
Usage is a great stat for all-rounders, because anyone who can bowl or bat a little bit gets that title. But a real all-rounder actually faces and bowls a high percentage of balls.
Fielding metrics now exist, but they are done off the TV, so are really more like reporting on errors. But it is at least a step in the right direction.
Magic number Fallacy
Never make the mistake of looking at one metric in isolation. Even average in Tests doesn’t always tell the full story. Henry Nicholls averages 39 overall, but 48 at home and 29 away.
There is no magic number. Every now and then, someone will come up with a new version of this, but in truth cricket is way too complicated for a single number.
Jade numbers
We could call these all Jade numbers instead of true, because of the impact he had on me creating them.
Dernbach’s true economy in ODIs was -0.78. Bad, but not the worst ever. In all T20s, he was actually 0.15. So he was a plus bowler, even as the commentators were saying how expensive he was.
Dernbach is not a numbers person in real life, but he knew he was bowling the tricky overs, and actually doing pretty well in them. These numbers let us know more about the game than ever before.
Fascinating use of “true” stats — once again, “context is king”!
And cricketers already know this, but have never had the stats to back up the intuition.
I play Seniors (over 60s) County. Opening bowlers often get through their spells going at less than 2 runs/over. I used to manage this, when I took the new ball as a specialist bowler, but now, 4 years later and now a “batting all-rounder”, I bowl in the middle overs or “at the death” and go at twice the run rate; my strike rate has halved!
I have not become a radically different bowler — 4 years older, probably a little slower — but bowling later in the game is so very different.
My “true” stats? It’s over 60s 4th XI…stats recorded as post-match pints/game! And I am getting better.