

Virat Kohli vs Ricky Ponting: mirror images of greatness
They both hit unbelievable peaks and noticeably tapered off towards the end, while making you still feel winning was the only thing. But who was better?


My girlfriend in the early 2000s was into sports, but not a massive cricket fan. But there was one cricketer that she always watched; Ricky Ponting. When asked about why this was the case, she said, “Look at him, he just wants to win. He is desperate for it. He is not shy about it. You can see it in every moment he is out there.” You didn’t need to watch sport to know that about Ponting. It was obvious.
In 2017, I said Virat Kohli was the Indian Ricky Ponting. There were plenty of cricket reasons, but it was about their batting personality as much as anything. Both reached for the ball, not because of a technical reason, but because they wanted to hit the ball as early as they could. They wanted the bowlers to feel the impact.
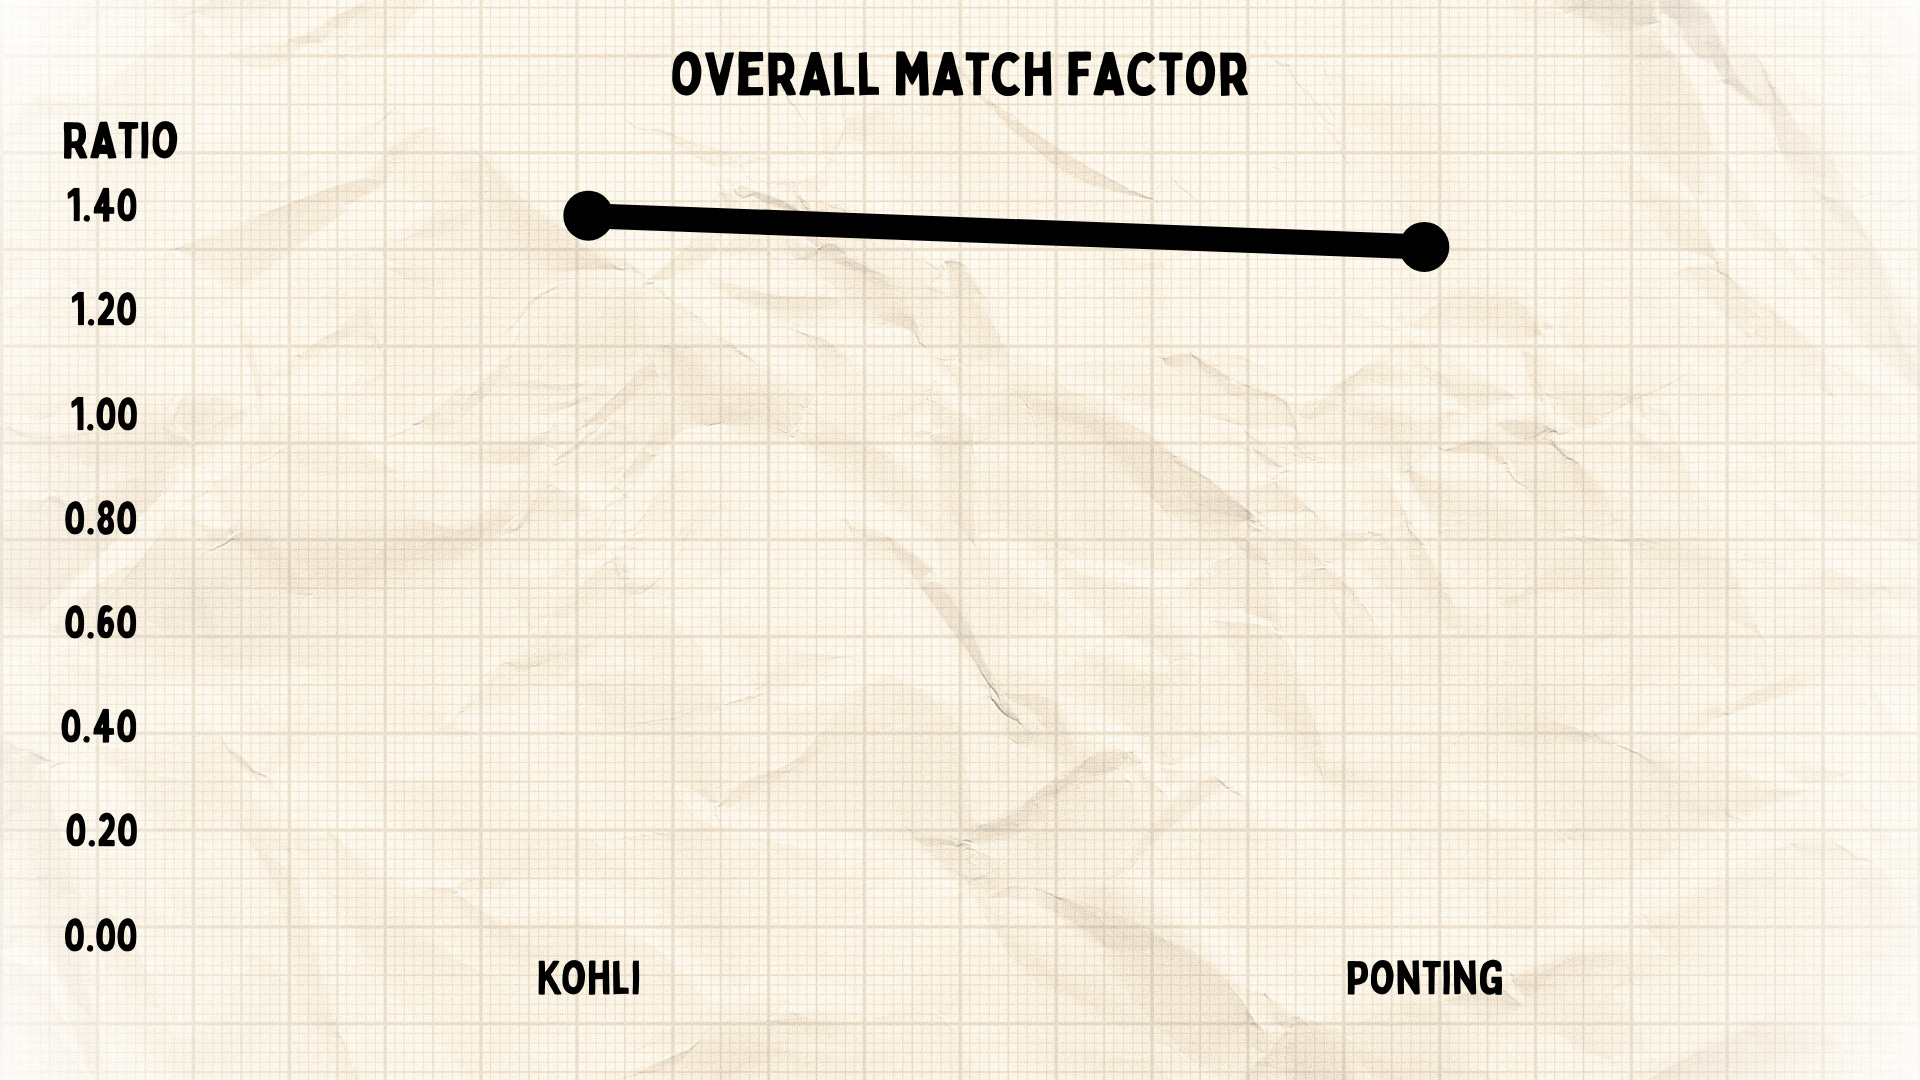
This was a sports writer looking for a comp. But over the years, I actually felt it more. And when looking at their Test records, we see how much they have followed each other. There is not much of a difference between the two lines on this graph. We see batters with a solid start to Test cricket, followed by outstanding peaks, and then the phase when they were just about par. In fact, it would be hard to tell which line represents which batter if we didn’t label them.

There is another way to look at just how good they were in their prime. Ponting achieved 942 ICC Test batting rating points, the joint fourth-highest of all time, while Kohli had 937, tied with Marnus Labuschagne at number 11.
Captaincy was another thing in common between the two stars - Kohli led India in 68 matches, winning 40 of them, while Ponting had a win-loss ratio of three in 77 Tests. During their tenures - and even otherwise - we saw their sheer passion to win games of cricket. It is not to say that the others don’t want to win - that is the hallmark of professional athletes. But it almost became a Michael Jordan-esque obsession for these two.
Ponting spitting out blood. Kohli screaming at the stumps. Both on the front foot, even when on the back.
They’re two guys with a mission that is shown in their batting. But as of now, who has had the better Test career?
Despite a significant dip in Kohli’s Test returns over the last five years, he has a career match factor of 1.38. Compared to Steve Smith - a batter with a similar sample size in Test cricket - that mark is not as elite, but despite what the internet is often saying now, it is clearly still the record of a great. Ponting was 32% better than the top six batters in the matches he played, so Kohli is a bit ahead.
But we have to consider that the Australian legend has batted with and against more great batters in his career as compared to the Indian. Also, both of them played a significant amount of their games with a great bowling attack, which helps with the match factor as the opposition’s top six batters would normally have a lower average.
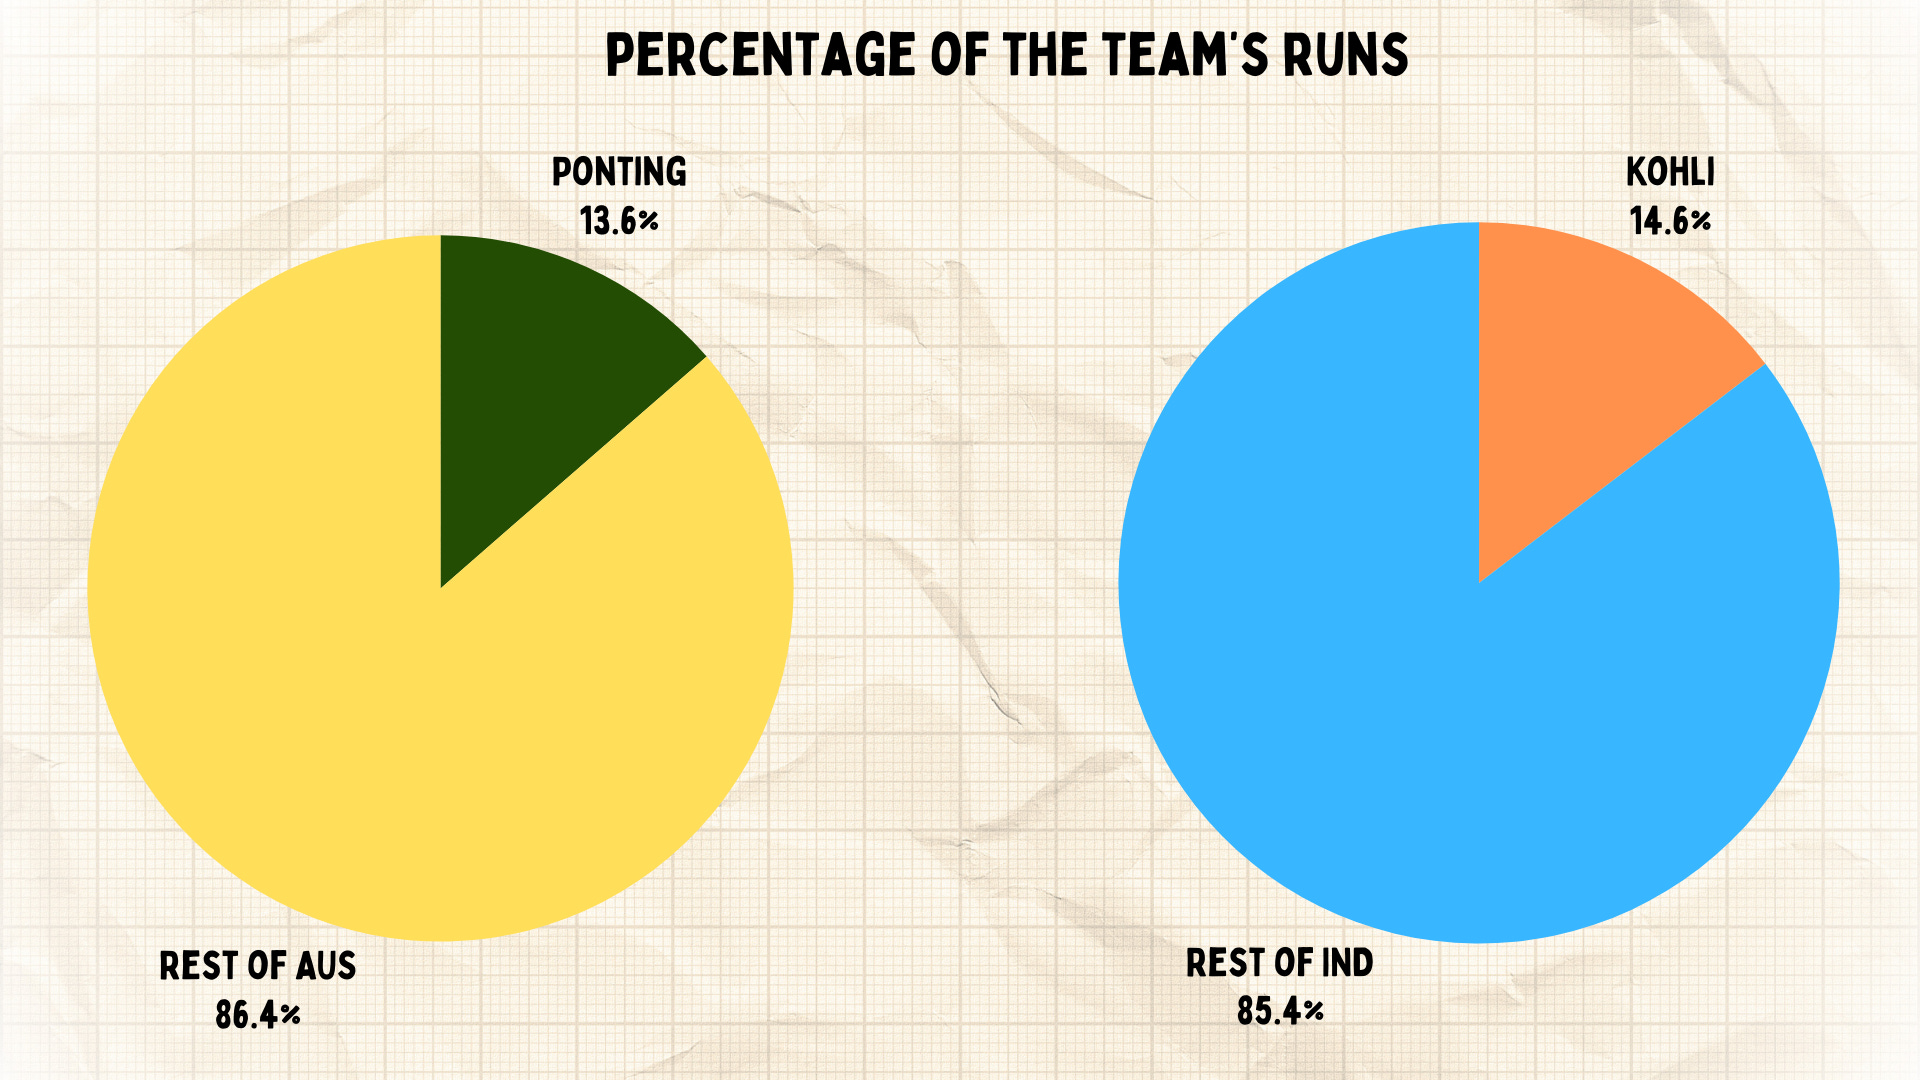
We see this in their contributions to the total runs as well. Kohli has scored 14.6% of India’s runs in the matches he has played, while Ponting is at 13.6%. But Ponting batted most with the likes of Matthew Hayden, Justin Langer, Michael Clarke, Mike Hussey, Adam Gilchrist and Steve Waugh. On the other hand, Kohli played most frequently with Cheteshwar Pujara, Ajinkya Rahane, Rohit Sharma, KL Rahul and Murali Vijay. That suggests Ponting had greater batters around him.
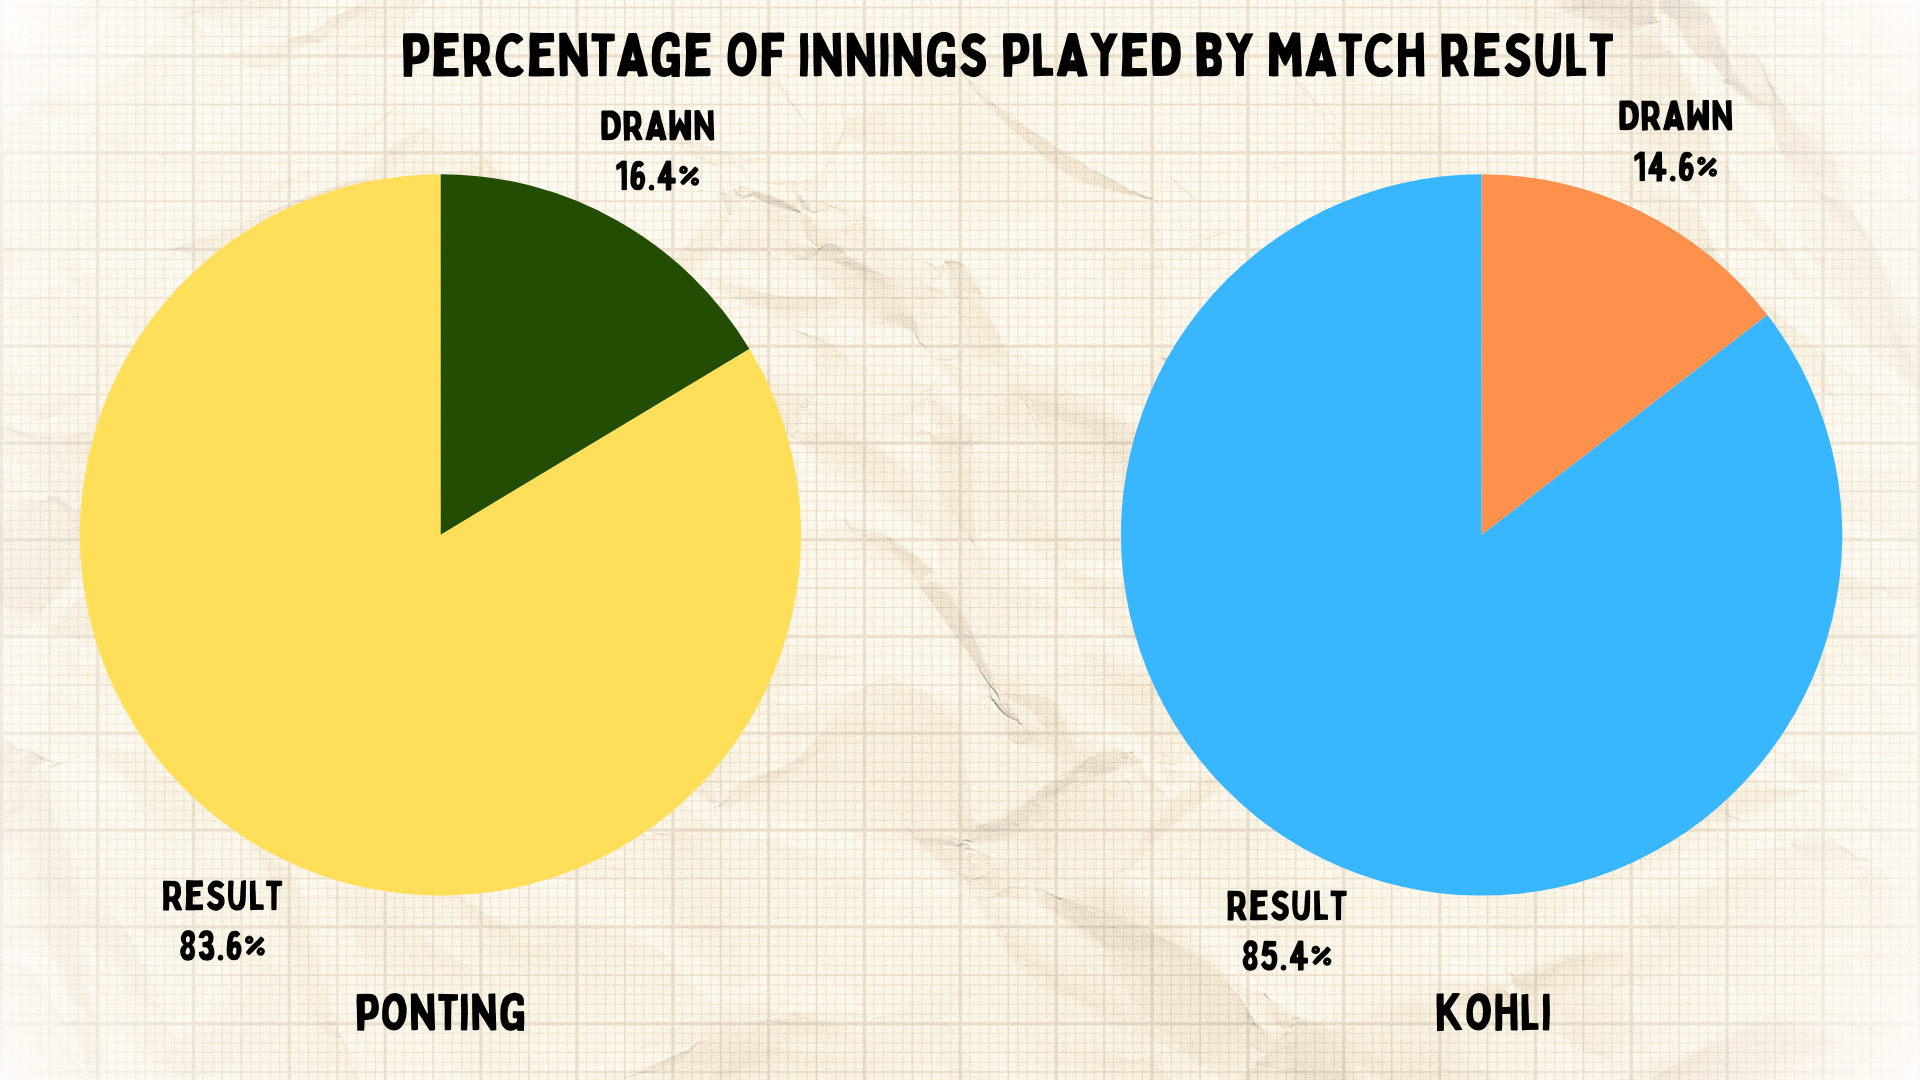
Even though Kohli is playing in the World Test Championship era, which has led to more result-oriented matches, there is not much of a difference between him and Ponting in terms of the percentage of innings in drawn Tests. One of the factors behind this is that Australia’s bowling attack was one of the best ever in Ponting’s time, and the team started pushing for results with their batting. And Ponting’s aggression was a big part of that.
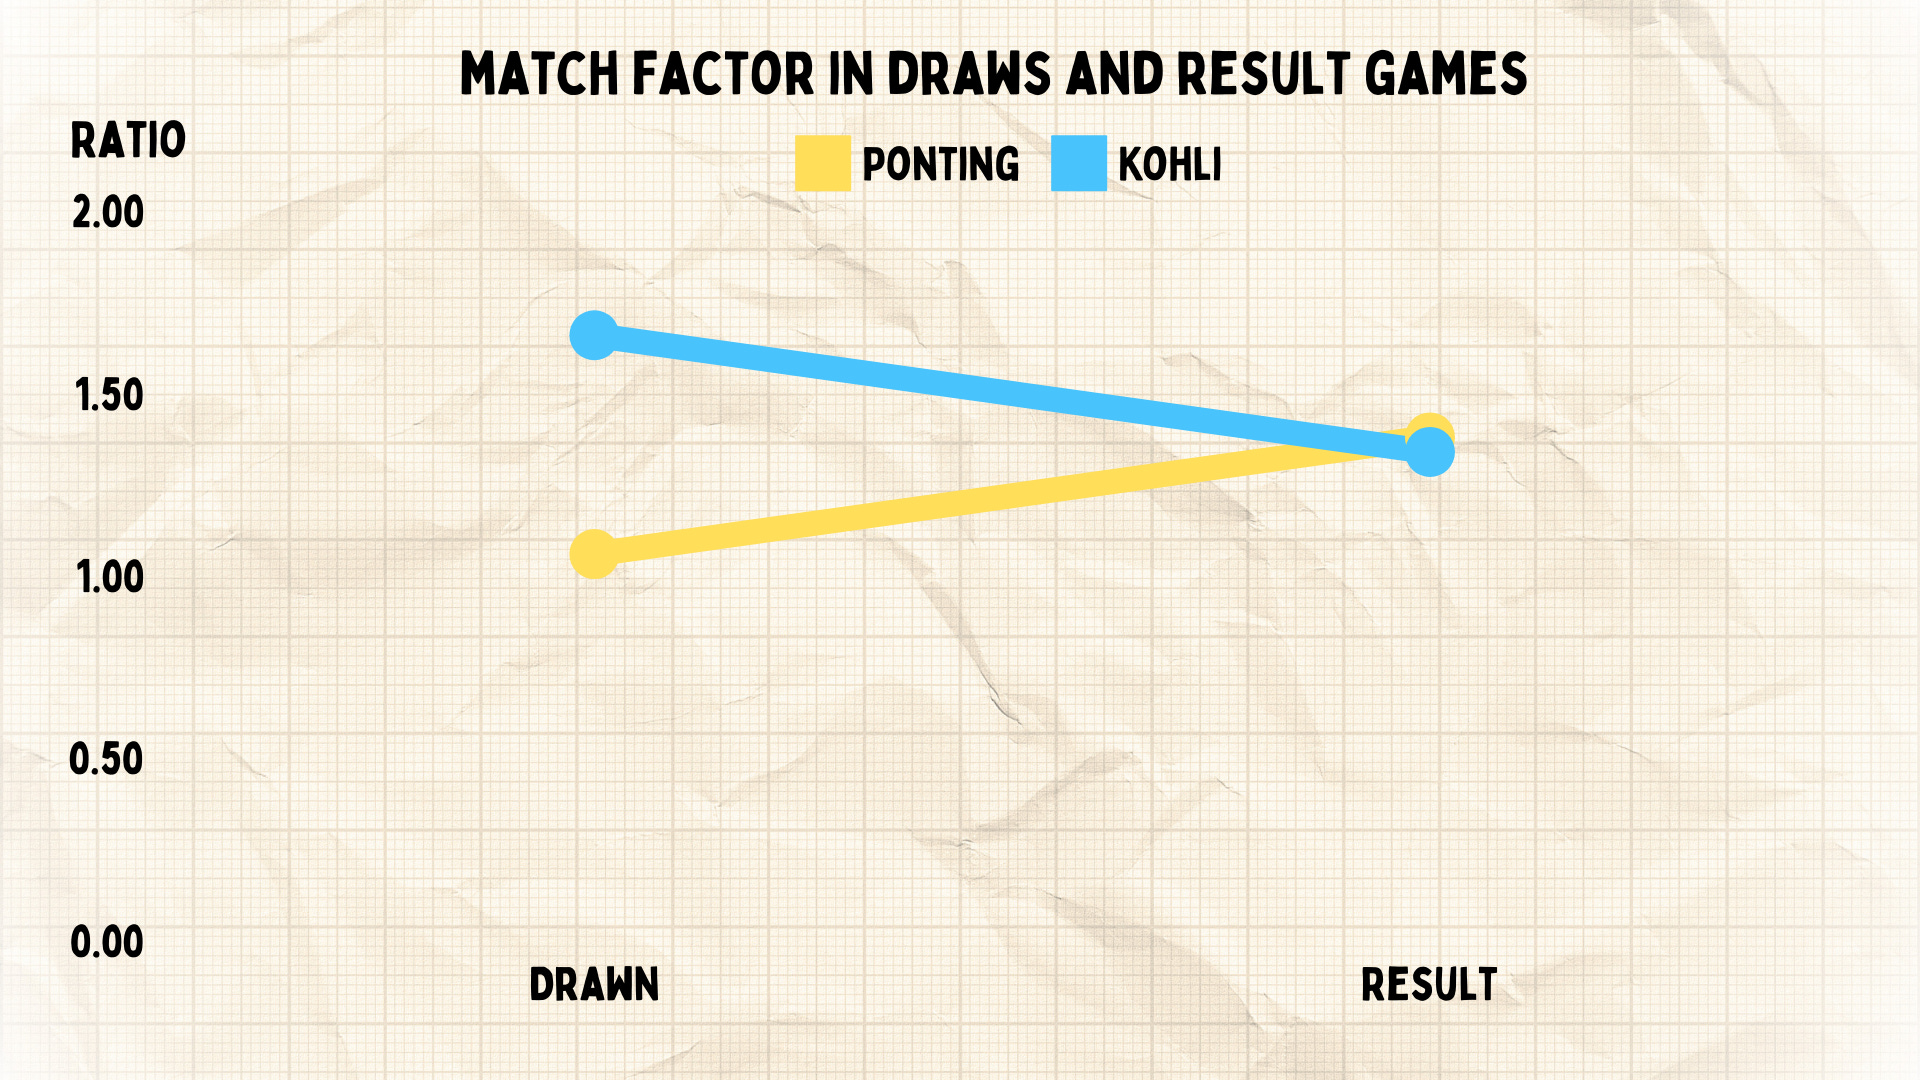
But Ponting didn’t really stand out in draws. He averaged 52, and was only 6% better than the top six batters. On the other hand, Kohli averages 72 in these matches at a match factor of 1.66 - even if he hasn’t actually played too many such games. In result matches, Ponting is ahead - 1.38 compared to 1.34 for Kohli. It actually means Kohli is a bigger beneficiary of draws as compared to Ponting.
We can split Ponting’s career into three parts. He averaged 10% less than the other batters till 1998, was 70% ahead for the next eight years, and then was par for the matches he played in the last six years of his Test career.

Till 2015, Kohli did well in Tests, outperforming the others by 18%. For the next four years, he is 94% ahead of the rest. But in the 2020s, he has basically been par.
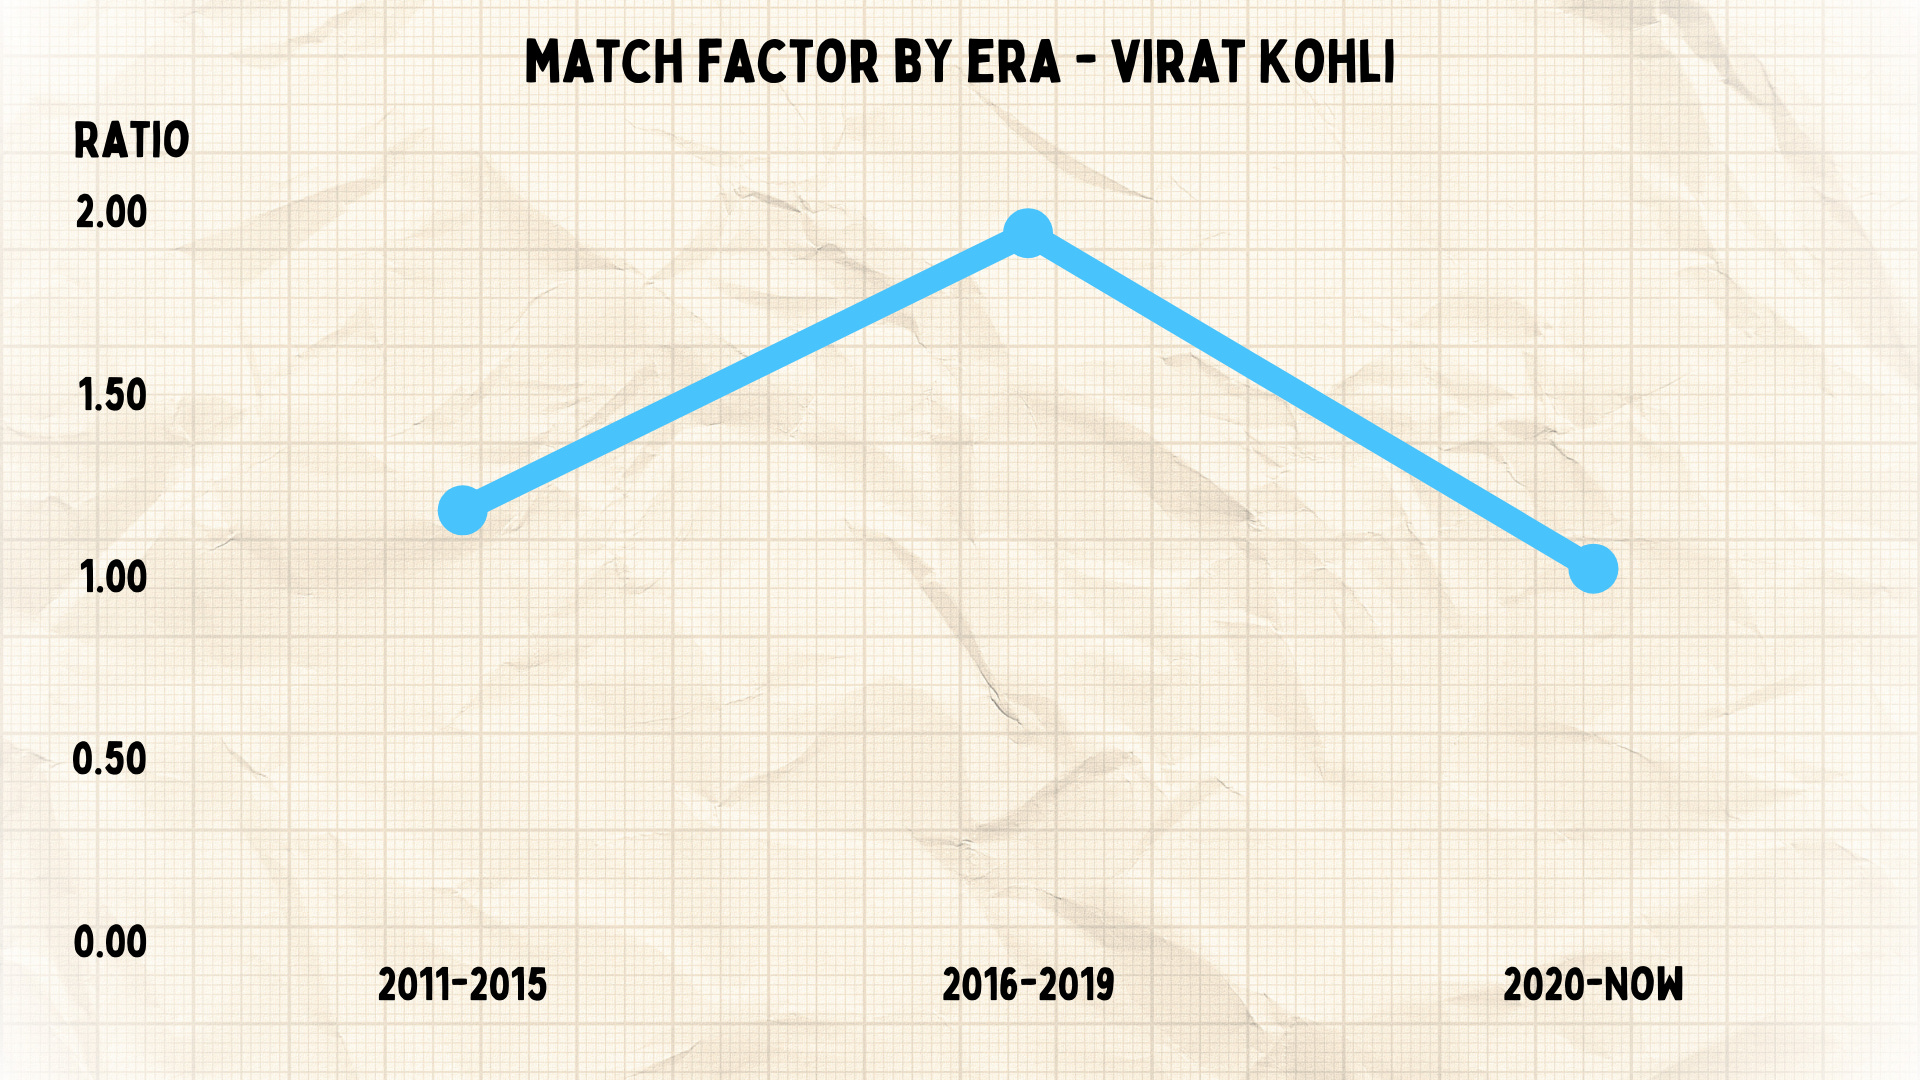
We can see that Ponting’s peak was longer, but Kohli’s was higher.
-
Because we knew that Ponting and Kohli’s careers looked very similar to each other, we wanted to see if there was anyone else we could find.
The closest we could find was Hashim Amla, who also had a terrific peak - although not at the same level - and was just above average on either side of it. Gordon Greenidge had a slower start than Ponting or Kohli but did better at the end of his career. Javed Miandad never had the same Everest, but he was really good even before his prime, after which he dropped off.
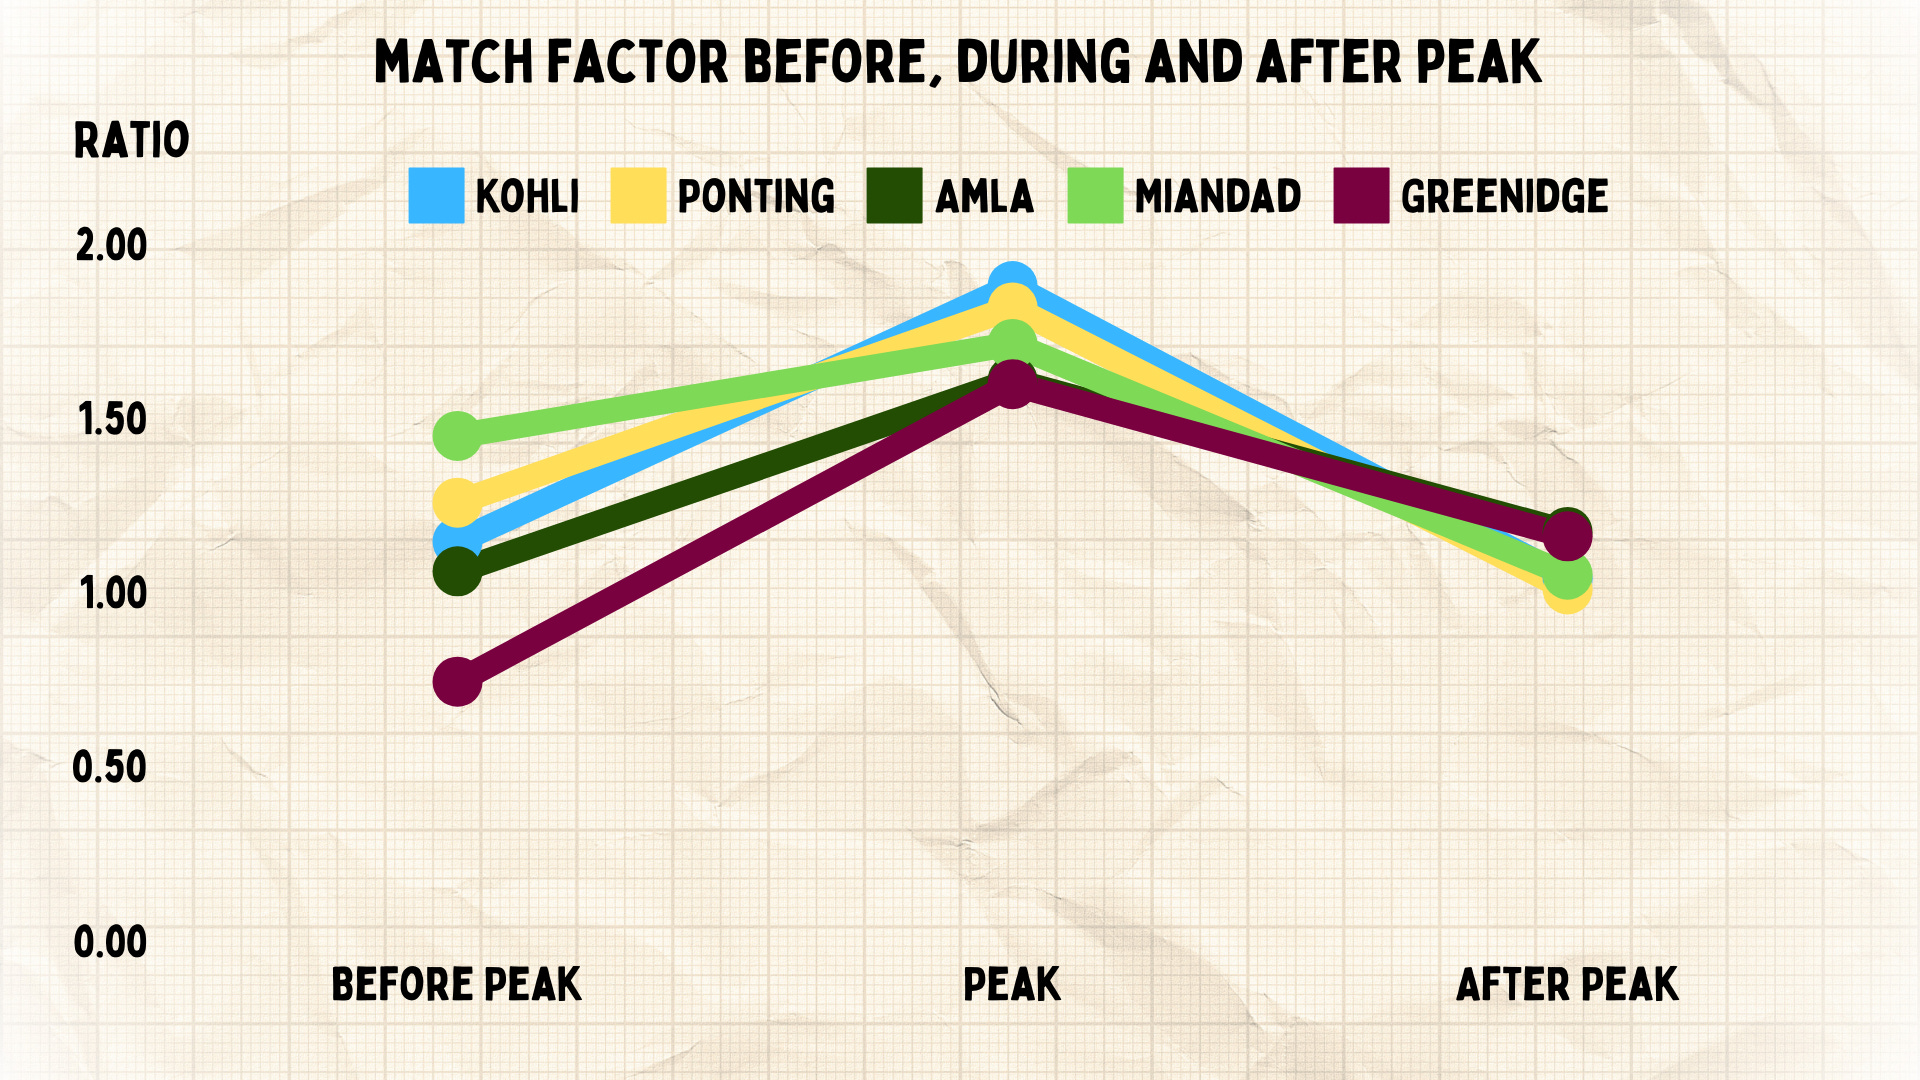
This pattern is really common. Most players start slow, get good in their prime, and then ease off. However, it doesn’t happen as much with greats. The players we mentioned above are some of the best batters to live. But what gives them that status is what they did at their best, because outside of that, they were not that special.
Ponting has the fourth-best average of all time in an 80 innings (the length of Don Bradman’s career) streak, averaging over 75. Kohli makes the top 25 as well, with an average of almost 63. Ponting’s nearest neighbours are Jacques Kallis and Garfield Sobers, while Kohli’s are Younis Khan and Amla.
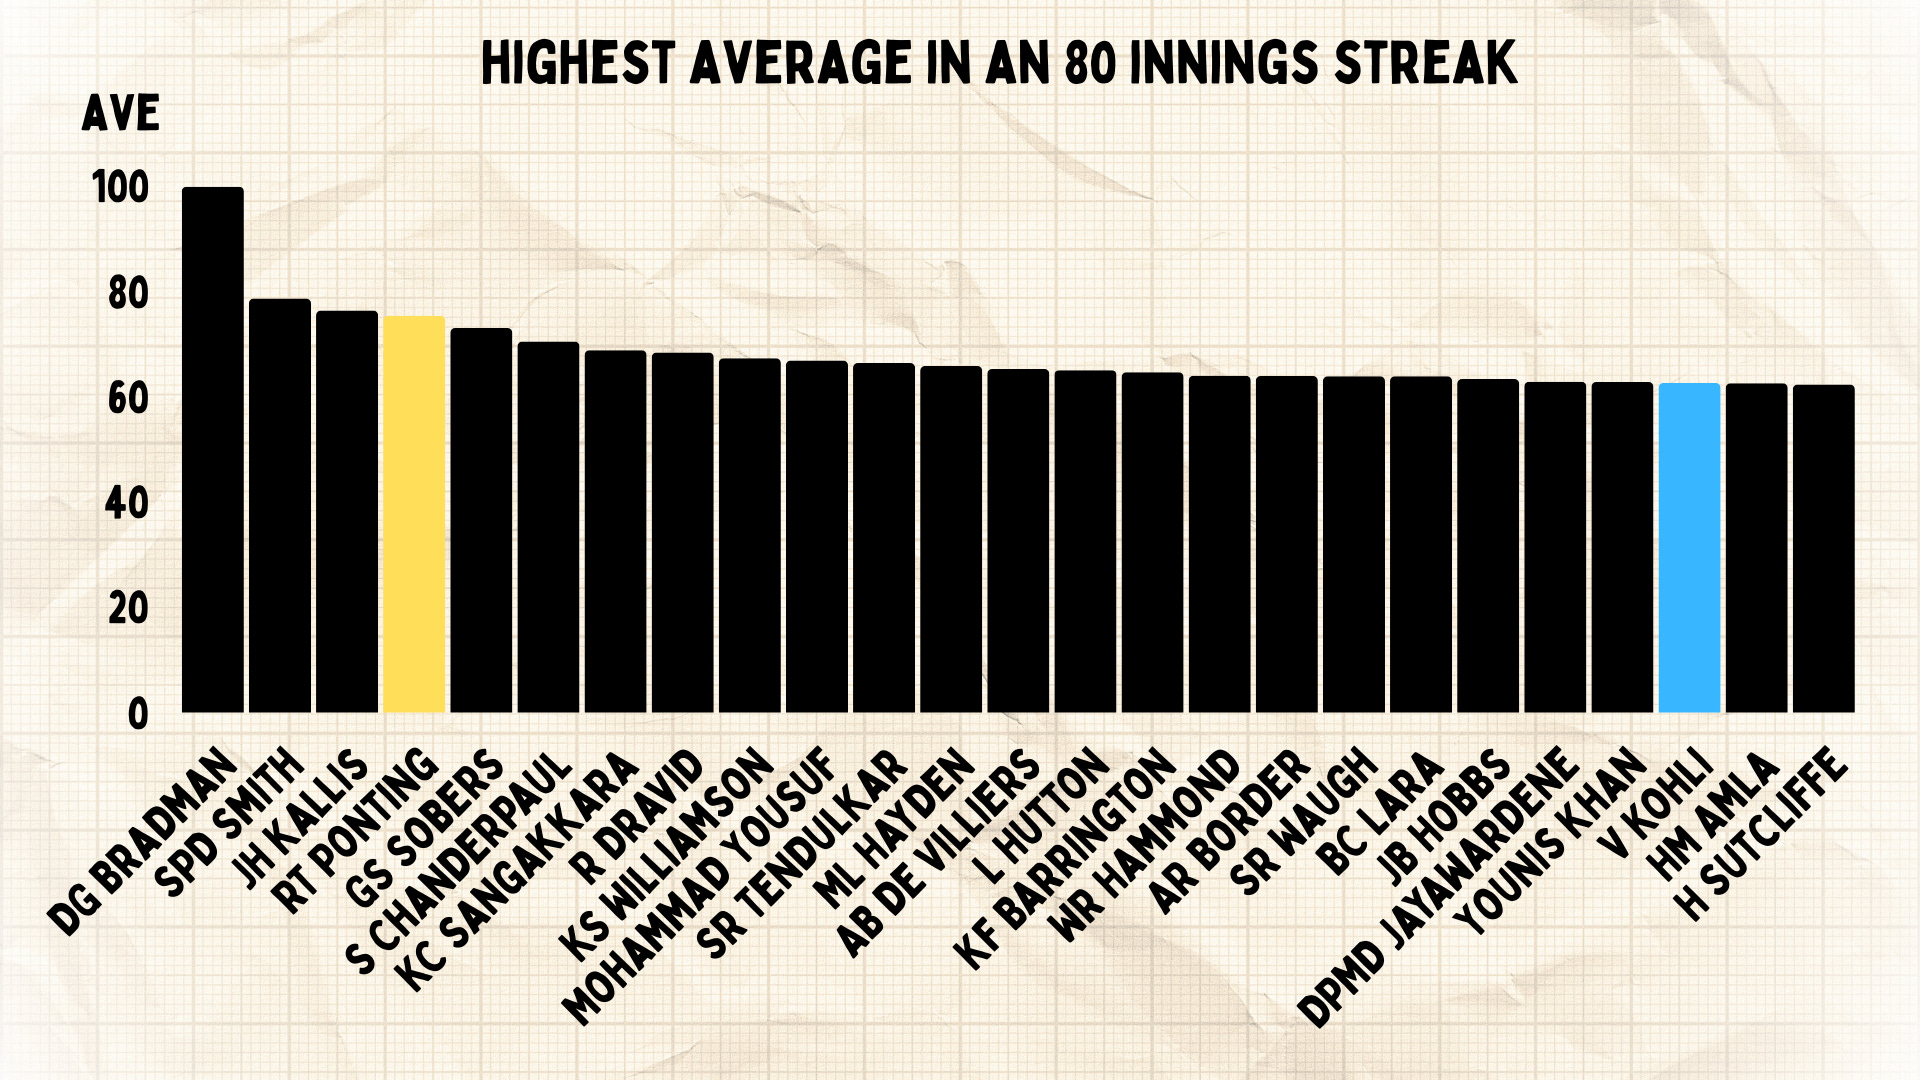
Ponting’s peak does almost completely overlap with a great batting period. So you would expect him to have a high average. Even accounting for that, an average of 75 is phenomenal.
When we look at the match factor, Kohli jumps up significantly in the list. Only six batters in Test history have had a better ratio in their best 80 knocks than Kohli, while Ponting is ninth. In a relative sense, there isn’t much between their peaks. The key difference is that the other top six batters averaged 32.5 in Kohli’s matches, while it was up by nine more runs in Ponting’s case.

Kohli’s peak lasted from November 2015 to December 2020. At home, he averaged almost 80 and scored 10 hundreds, six of which were double tons. He averaged over 40 everywhere in the world apart from New Zealand, where he had a terrible series (38 runs in four innings). He had all-time great tours of England and South Africa in 2018, and he played some of his best knocks across conditions in this period.
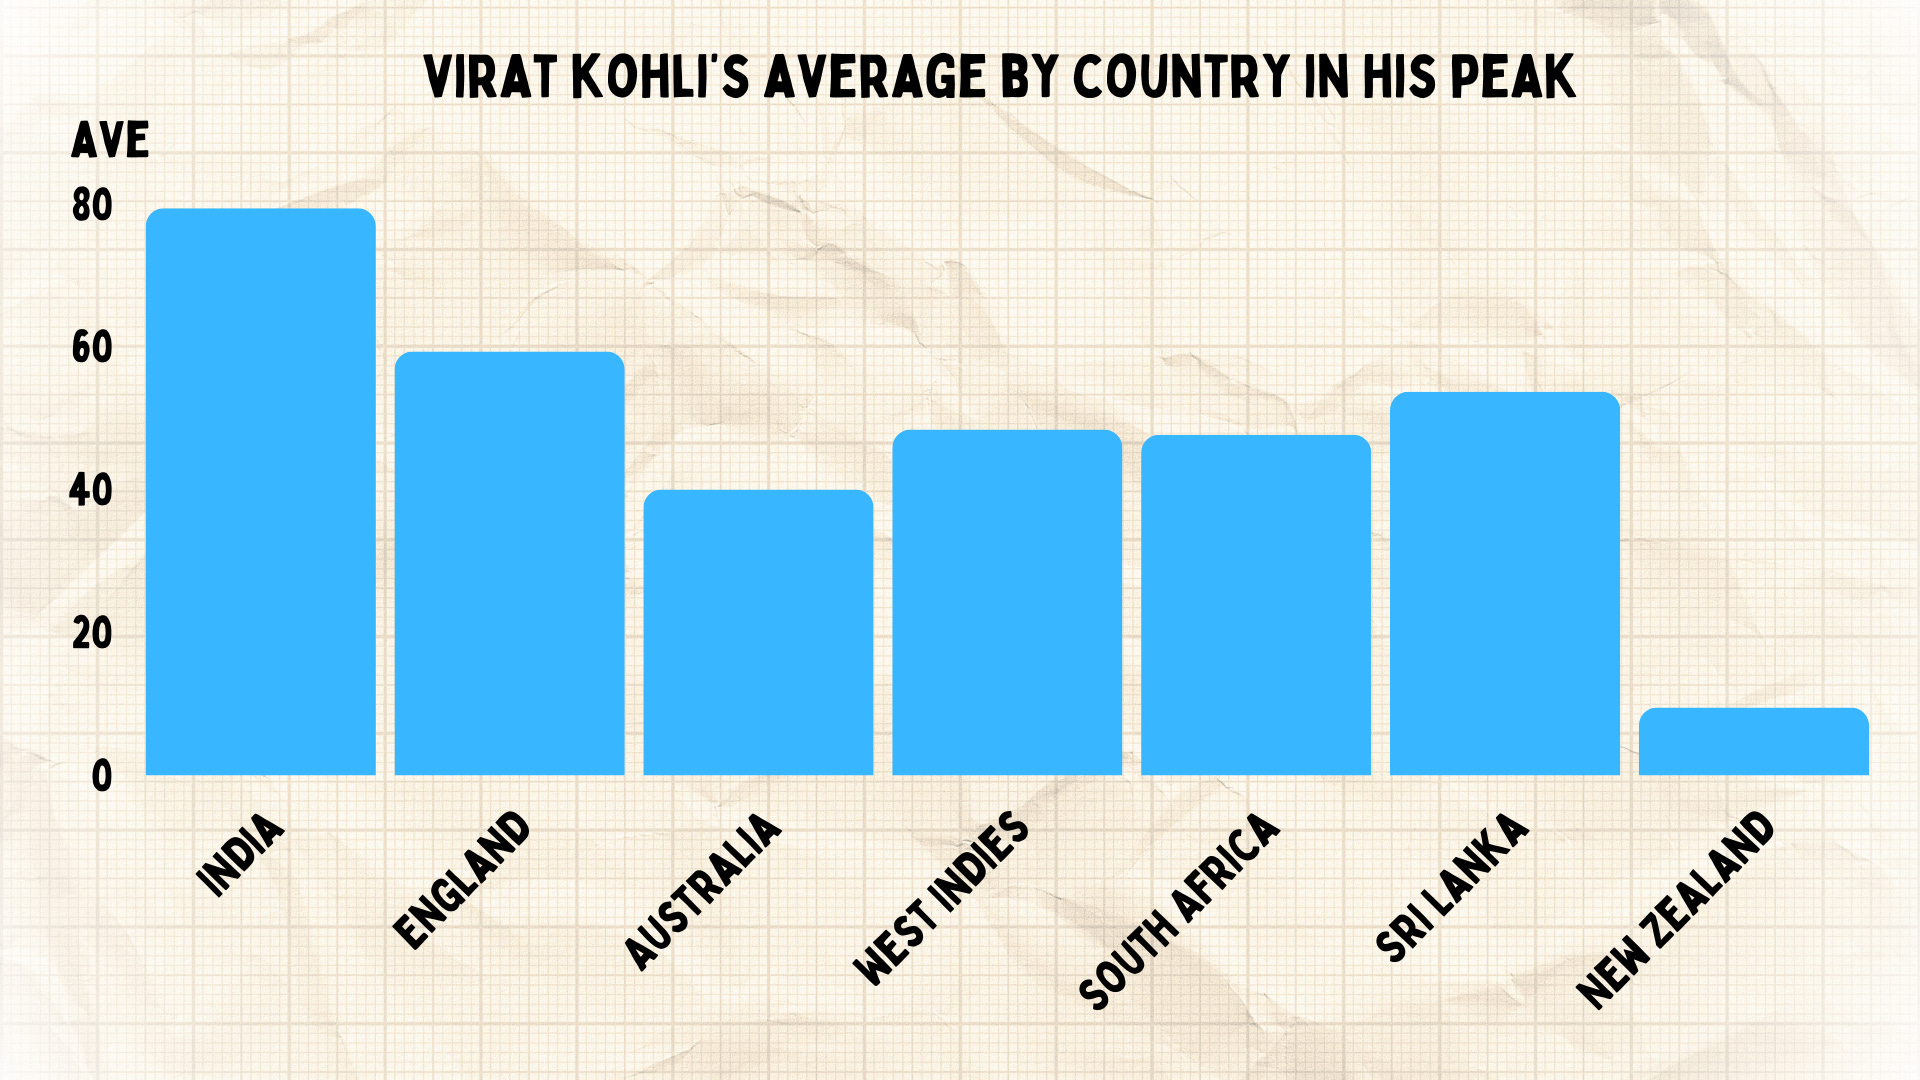
For context, the pace-playing pandemic starts to occur in 2017, but really spread the following year. So it shows that Kohli was making runs when others were struggling, at a rate few have in history.
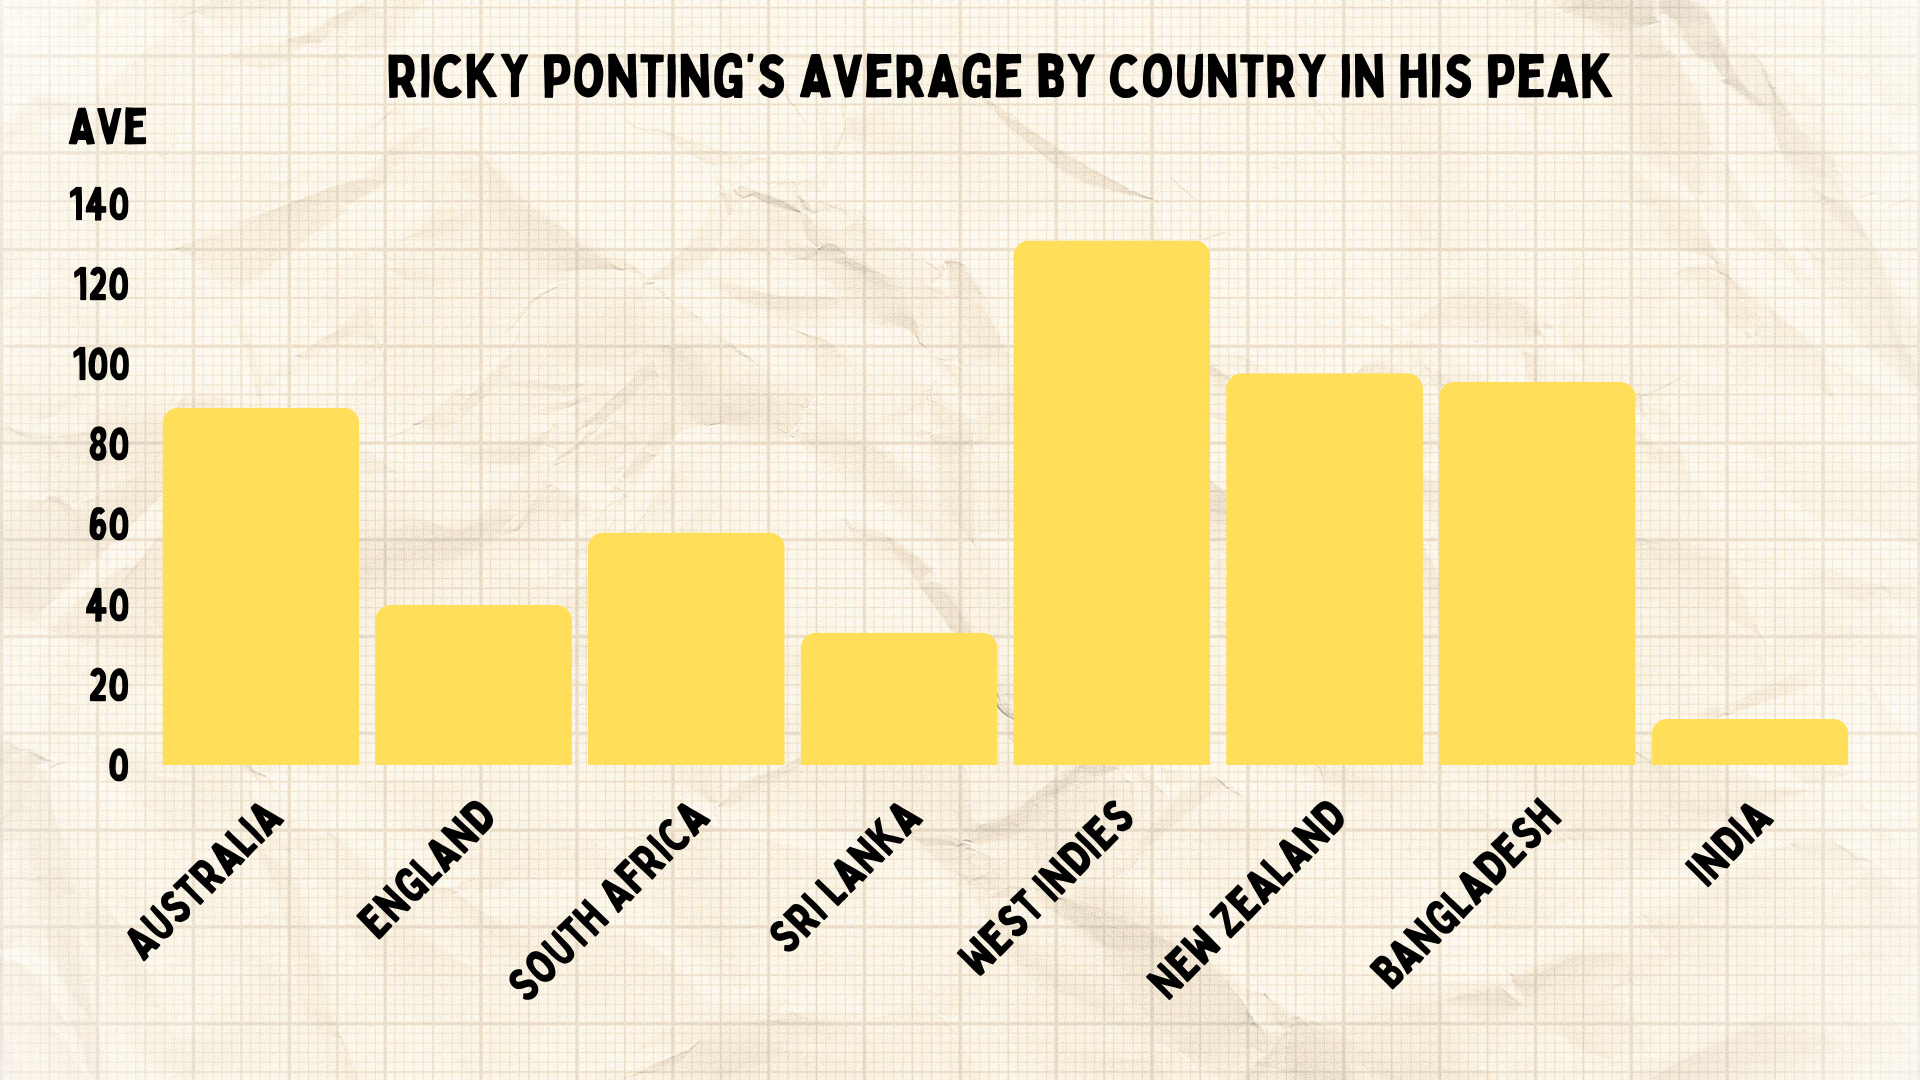
Ponting’s best stretch of 80 innings lasted from April 2003 to December 2006. That was some time to bat. He nearly went at 90 runs per dismissal at home, while averaging 60 away. He did average just under 40 in England (that was the Ashes Australia lost) and 33 in Sri Lanka, but he was above 90 in New Zealand and Bangladesh and over a 100 in West Indies. He also averaged 58 in South Africa.
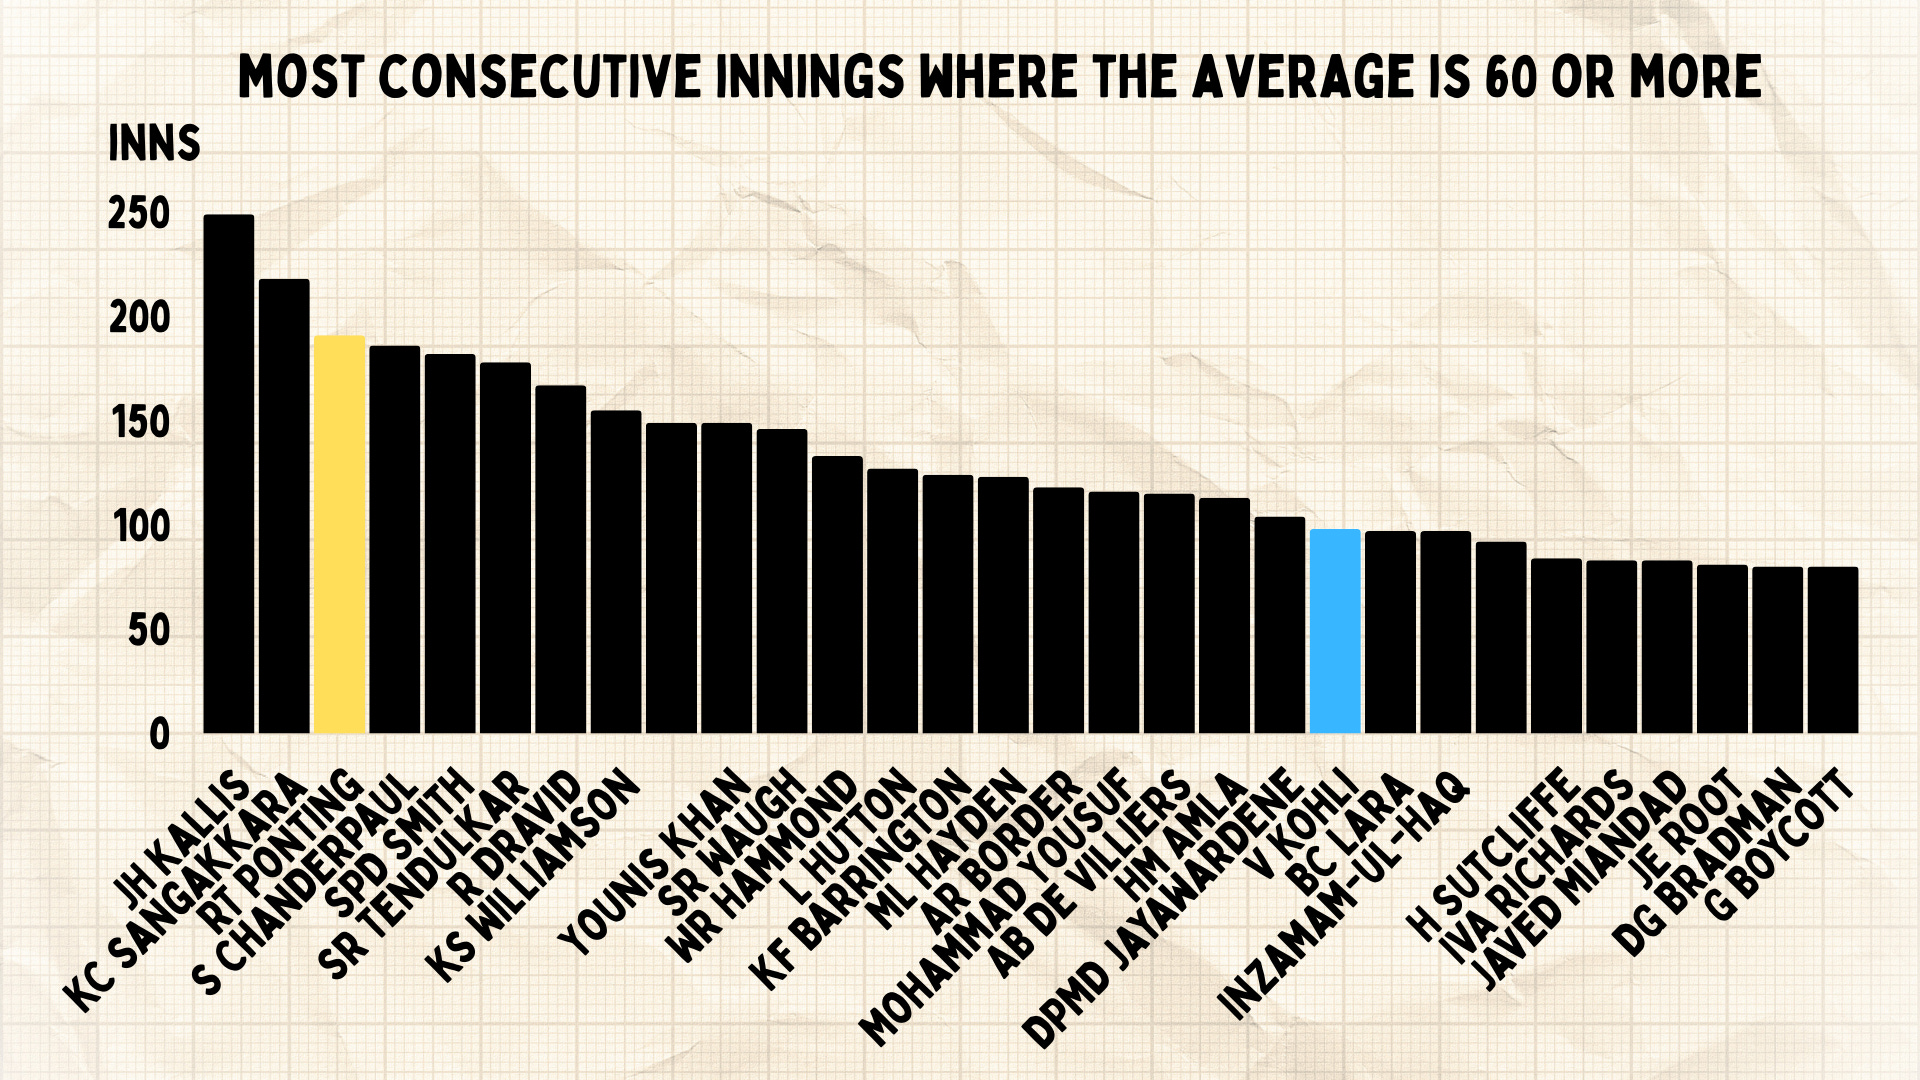
There are two ways of looking at the length of their primes. Ponting had a 191 innings stretch of averaging 60 - the third-highest ever. Again, Kohli makes the cut in the top 25.
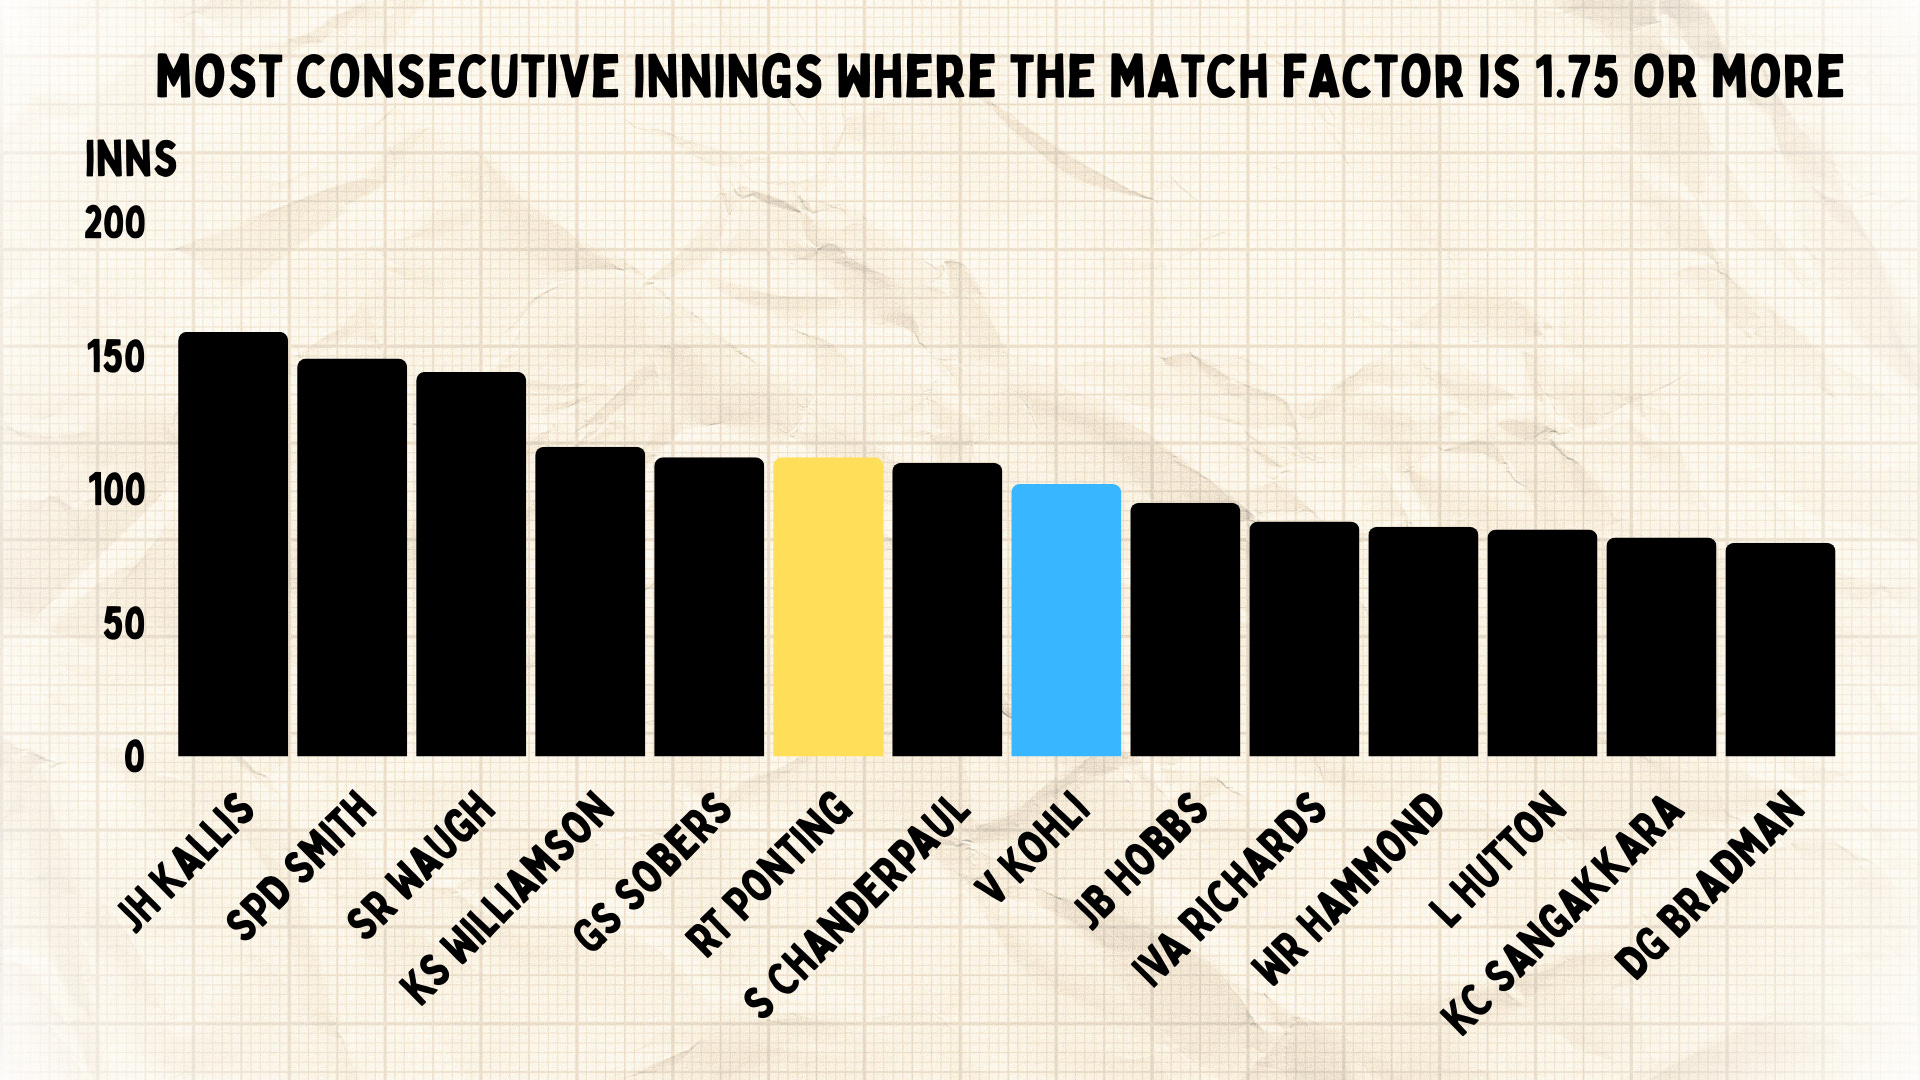
When we look at stretches with a match factor of above 1.75, they’re both in the top ten of all time, with more than a hundred such innings.
Both of their cases for greatness are from their peaks. And few ever climbed as high.
